We’re excited to roll out a cool update to our Player Overlap feature, now with even more detailed insights into player behaviour.
What’s new with player overlap and what can you gain from it?
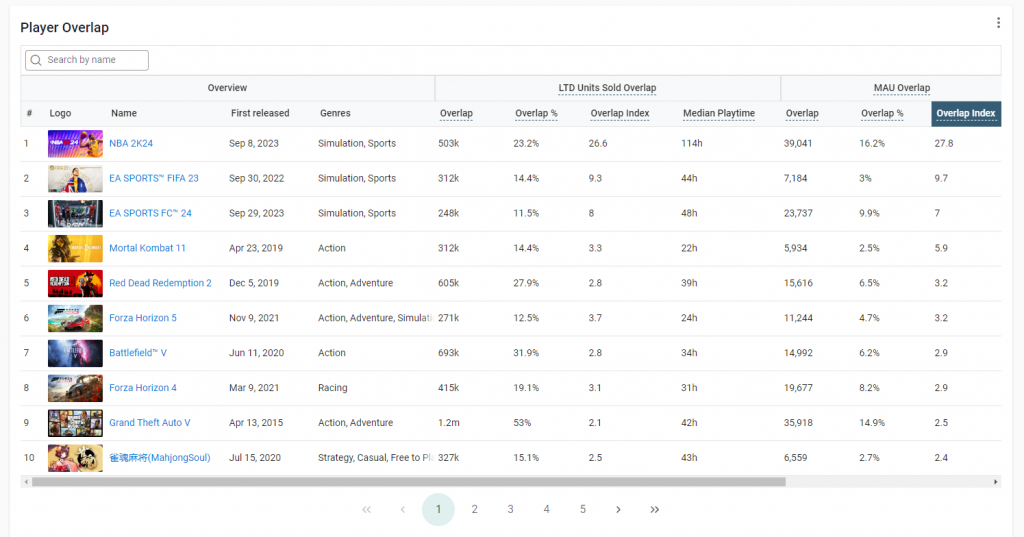
Using NBA 2K23 as our example, let’s explore a part of this further, just like we did in our last post about this feature.
Median Playtime: reveals how many hours a typical player dedicates to NBA 2K23, based on what other games they play. You’ll find this data for all games in the “LTD Units Sold Overlap” section of the table. So you can now not only see what else players play, but also how dedicated they are to the main game in focus. For example, people who bought NBA 2K24 spent over a hundred hours in 2K23 while people who play games like Forza or Battlefield tend to be more casual NBA 2K players.
We’ve also introduced wishlist-related metrics for more depth, available only for unreleased games. Learn more about them below:
Wishlist Overlap: Looks at players who wishlisted the main game in focus and what else they’re playing on Steam.
Wishlist Overlap %: Indicates the percentage of main game wishlisters who play other games.
Wishlist Overlap Index: Measures how much more likely main game wishlisters are to play another game compared to the average player. A value of 0.5 means half as likely, while 2.0 means twice as likely.
These new metrics offer our Business subscribers deeper insights into player behavior, helping refine marketing strategies and uncover market opportunities.
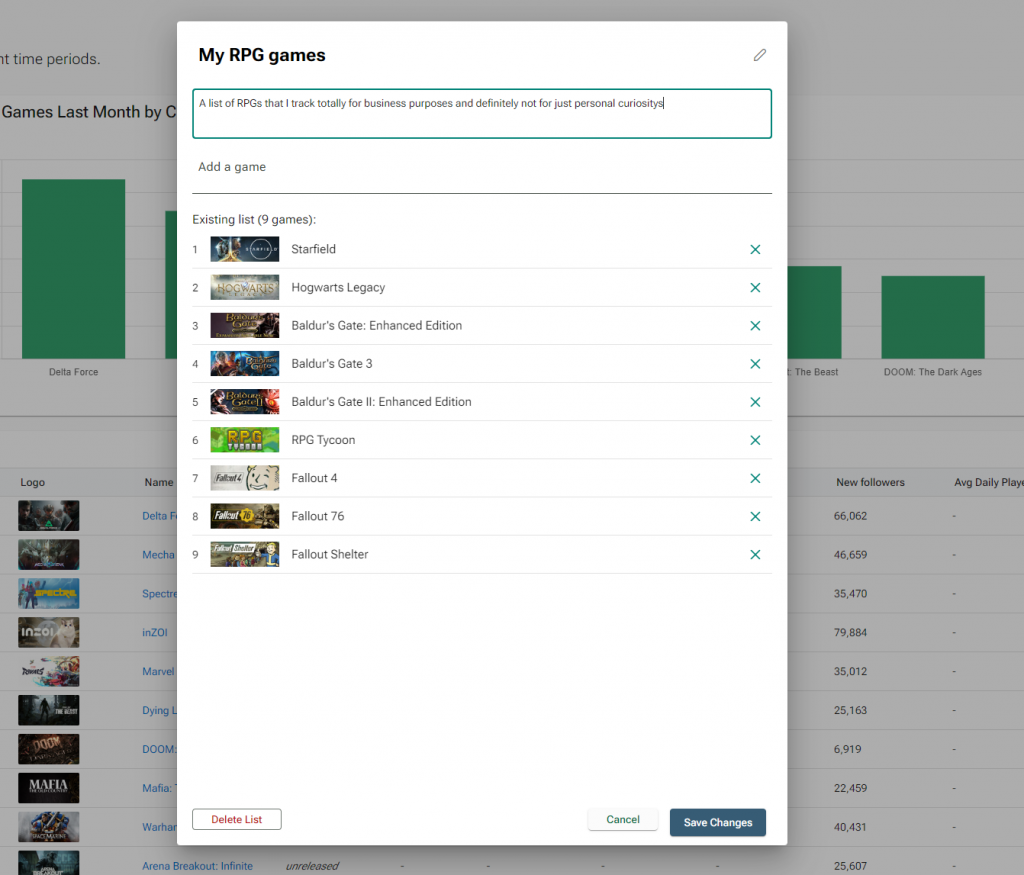
Custom Games Lists
Do you have a specific list of games you’d like to track or summarise data for? Well, now you can (finally)!
Indie and Business subscribers are now able to set up custom lists with whatever games they’d like. These lists can then be used on any page with filters (Games Database, Top Charts, Steam Analytics etc).
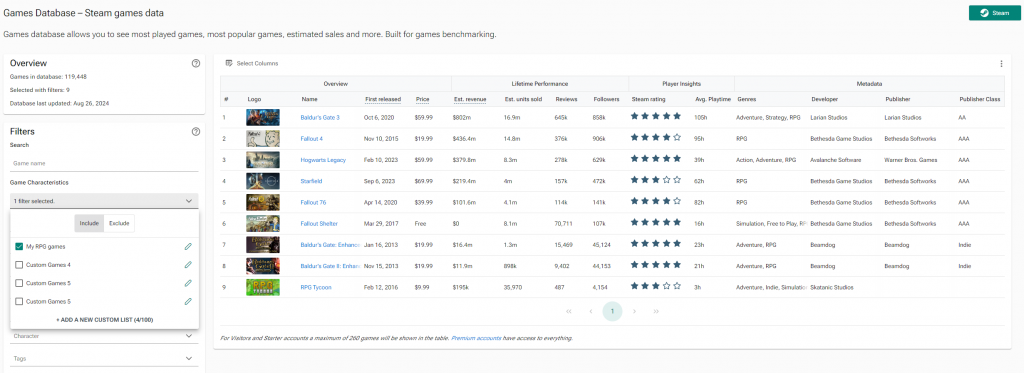
We have revamped our filter system, making it easier to use and improving its functionality.
Filters are available on many pages, from Steam Analytics to Games Database and can help you narrow down a list of games or companies to look at. We’ve long had an extensive list of filters to choose from, but we’ve now made it even more powerful to use.
Include / Exclude Filters
You can now include as well as exclude characteristics in filters. For example, you might want to see all 4x games, but exclude any turn-based games, leaving only real time 4x games in the list.
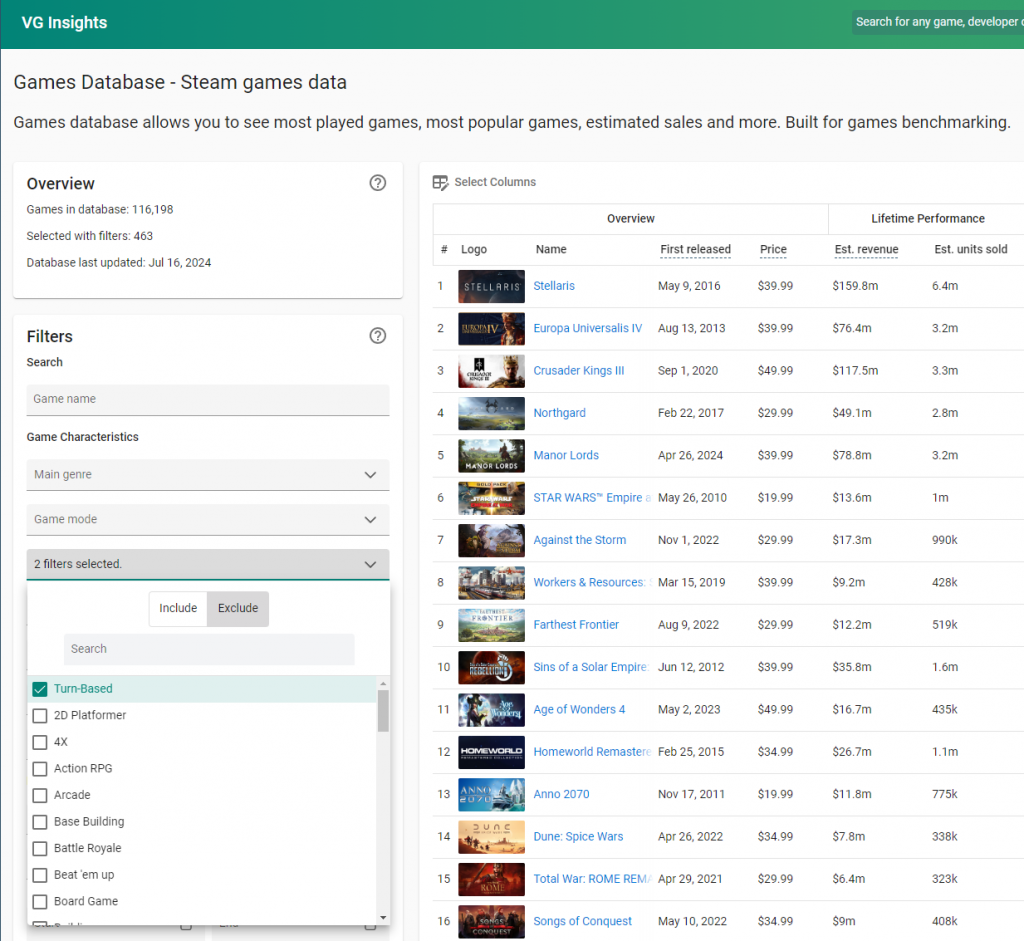
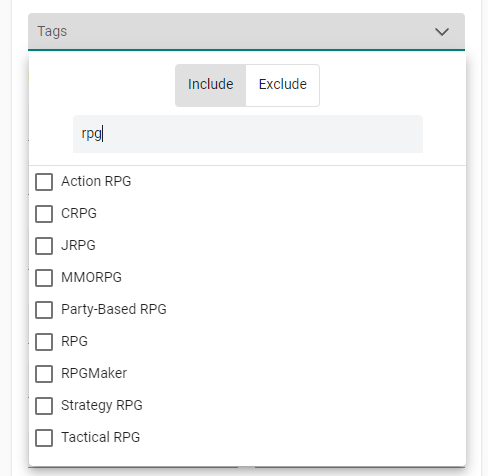
Search for Filters
Some of our filters had tens if not hundreds of options to choose from. We have now added a search bar to make it easier to look for the particular item you’re interested in. For example, you can now find all the RPG tags with ease.
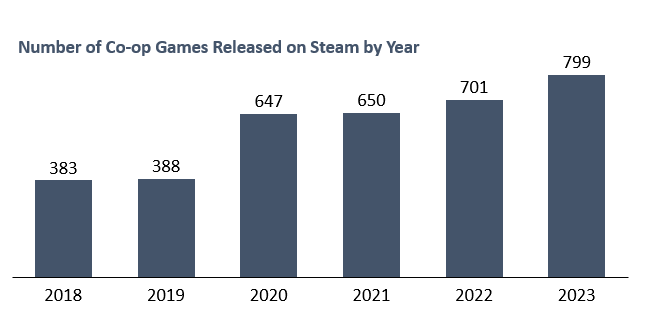
2023 saw almost 800 co-op games released on Steam, over double from five years ago.
The core principle for cooperative games is that a small group of players can work together as a team. Covid saw a peak in co-op game interest as catching up in the real world was swapped for social gaming sessions. This report explores how the co-op game popularity has trended since.
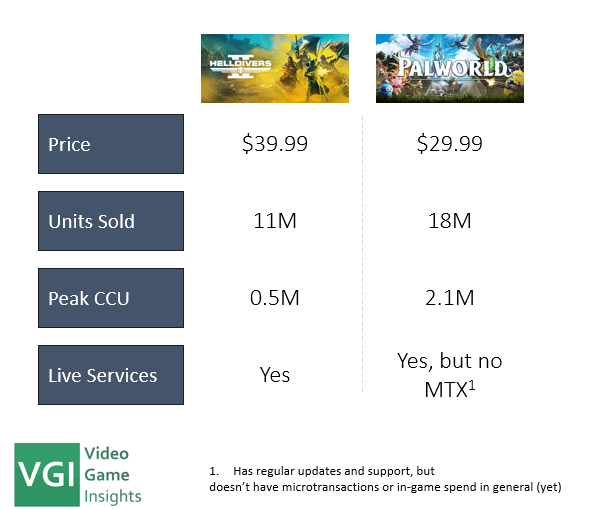
Co-op games tend to have an organic player acquisition flywheel where players persuade their friends to get the game. Therefore, co-op games tend to outperform other types of games in their performance. These organic hype cycles have become especially evident with the launches of Palworld and Helldivers 2 this year. The report looks into just how much audience attention share these games grabbed.
For many years, PlayStation has relied on platform exclusives to encourage players to buy its hardware and remain within its ecosystem. This strategy, also commonly used by Xbox and Nintendo, has been highly effective. However, since 2020, there has been a significant shift in this approach. This article explores why publishers are moving towards cross-platform strategies and examines how this shift has impacted PlayStation to date.
PlayStation’s move away from exclusivity
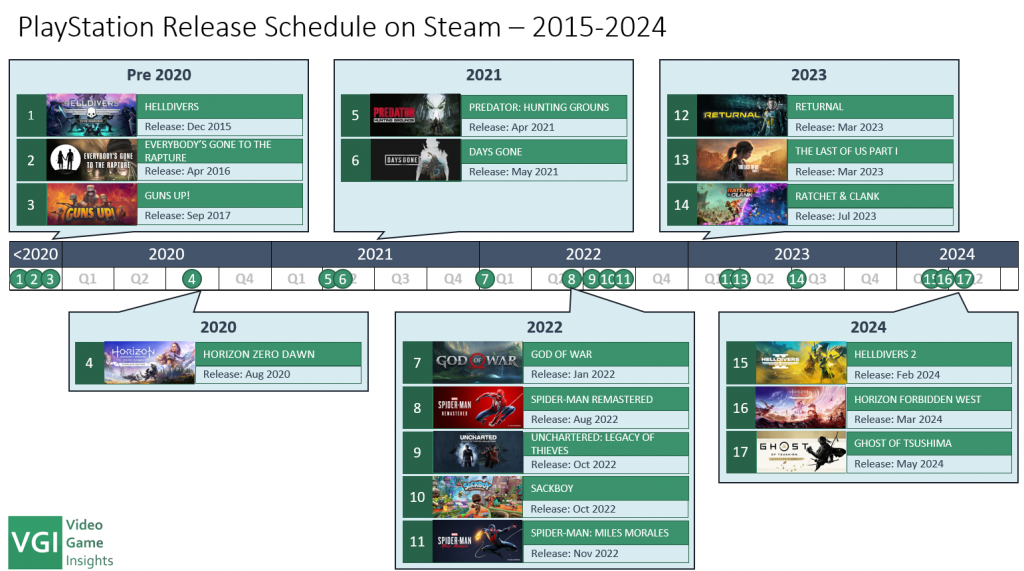
Up until 2020, PlayStation had released only three games on Steam. Their first ever game, funnily enough, was Helldivers. These initial releases were relatively minor in the grand scheme of Sony’s portfolio.
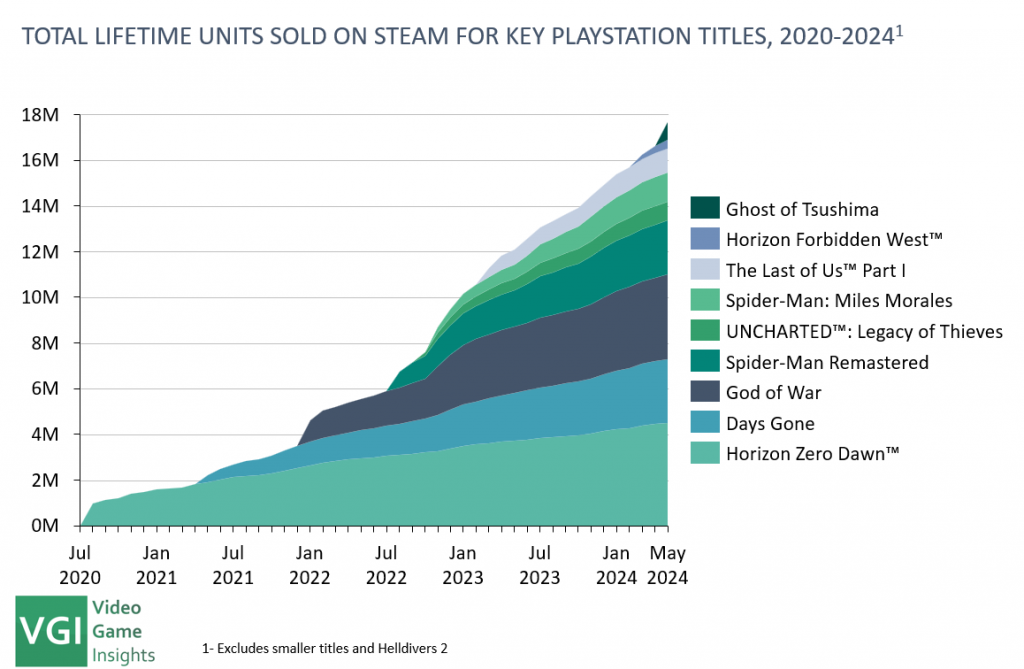
However, in August 2020, Horizon Zero Dawn was launched on Steam, marking the beginning of a significant shift. Since then, 14 PlayStation exclusives have made their way to the Steam platform.
The release strategy for these games can be categorized into three distinct approaches:
PC release approximately 3-4 years after PS release – This category includes major IPs like Horizon Zero Dawn, God of War, Spider-Man Remastered, and Ghost of Tsushima.
PC release 2 years after PS release – Titles such as Days Gone, Sackboy, Spider-Man: Miles Morales, Returnal, Ratchet & Clank, and Horizon Forbidden West fall into this category. These games are typically one tier below the top sellers and benefit from a shorter exclusivity window as their sales curves tend to flatten out sooner.
Day 1 PC & PS5 release – Live service games are released on both platforms simultaneously to maximize engagement rather than to entice PC gamers to switch to PlayStation.
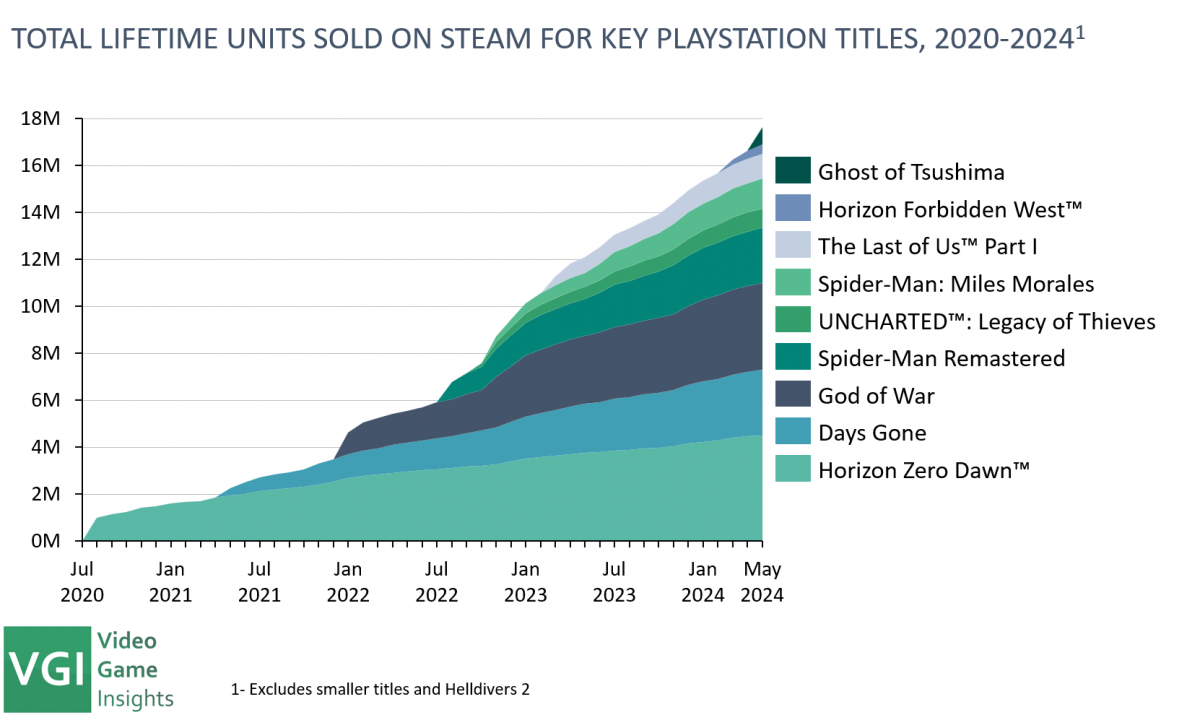
In total, these PlayStation ports have sold over 17 million units on PC, excluding Helldivers 2. Including Helldivers 2, the total exceeds 28 million units (yes, Helldivers 2 is that crazy).
All unit sales estimates are derived from the Video Game Insights platform data. Although these figures are estimates, they align closely with PlayStation’s reported and leaked numbers, providing a fairly reliable approximation of actual sales.
PlayStation’s PC Porting Strategy: Three Key Aims
Maximize Launch Sales on the PS Platform: By prioritizing initial releases on PlayStation, they save the 30% Steam platform fee. More importantly, it is an important retention mechanism. This approach encourages players to stay on the PlayStation platform to access exclusives upon launch. It’s a page out of the film and TV playbook, where HBO originals debut on HBO before becoming available on other channels and platforms later.
Optimize PC sales – Therefore, PlayStation aims to launch on PC once the primary sales cycle on PlayStation’s platform concludes. Given that relatively low porting costs, sales on PC represent a high-margin opportunity.
It’s a careful balancing act to get the porting timing just right, but there are clear advantages VS a full exclusivity approach.
How the Strategy is Paying Off: The Example of Ghost of Tsushima
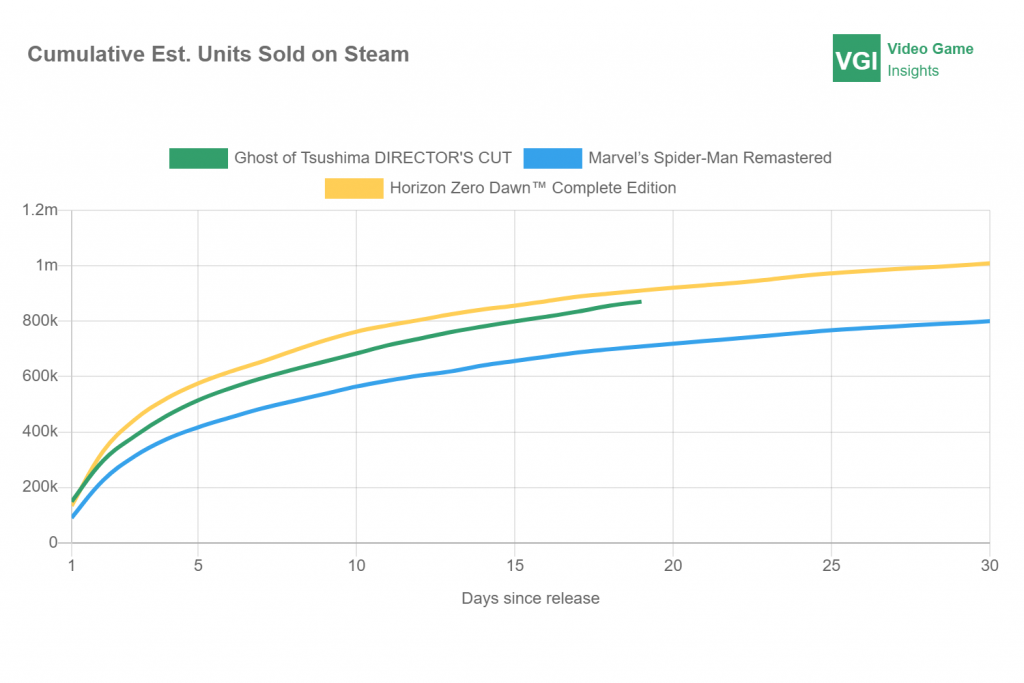
Ghost of Tsushima is the most recent example of PlayStation’s strategy, launching on Steam in May 2024, nearly four years after its original release. Its Steam debut was one of the most successful ports to date, with over 800,000 units sold in the first 20 days, comparable to the launches of Spider-Man and Horizon Zero Dawn.
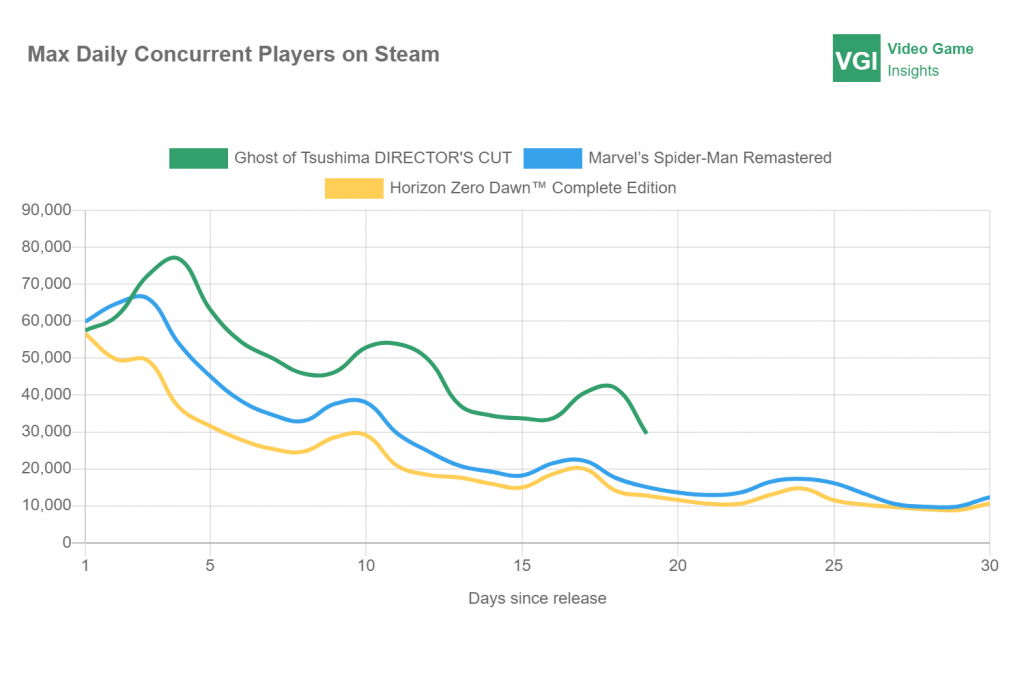
In terms of player retention, Ghost of Tsushima has performed even better. While it launched with similar concurrent player (CCU) numbers as Spider-Man and Horizon, it has maintained nearly double the CCU by day 20.
While Ghost of Tsushima is a great title and well received (90% positive ratings on Steam), it’s an objectively less known IP VS Spider-man and Horizon. Ghost of Tsushima sold well on PlayStation but didn’t get close to the other two. So, what made its launch so successful on Steam?
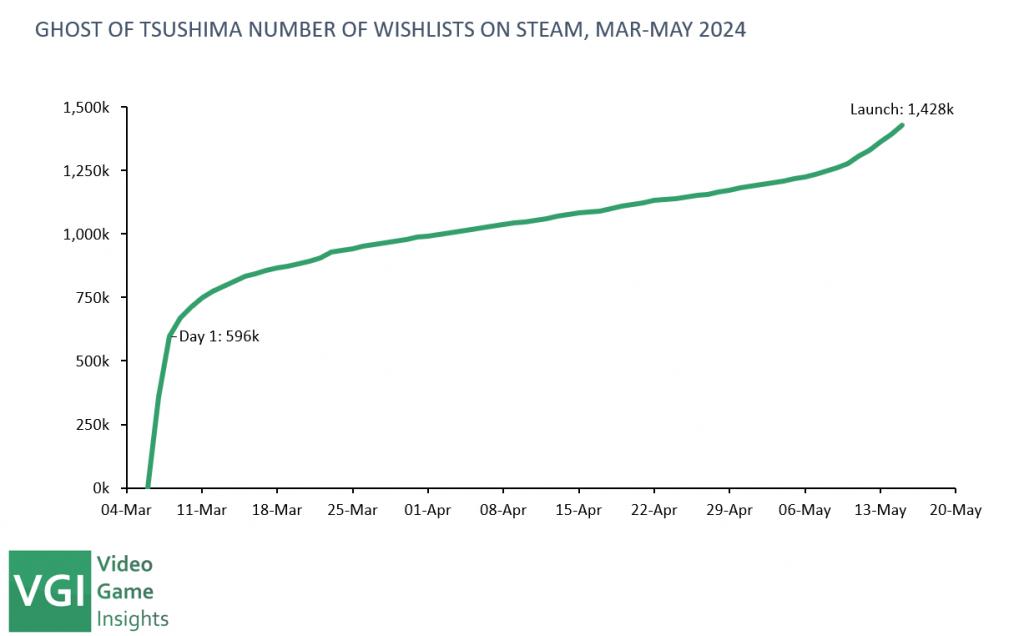
This success highlights the effectiveness of PlayStation’s Steam strategy. Ghost of Tsushima built up nearly 1.5 million wishlists within a couple of months before its launch, indicating growing trust and anticipation for PlayStation ports.
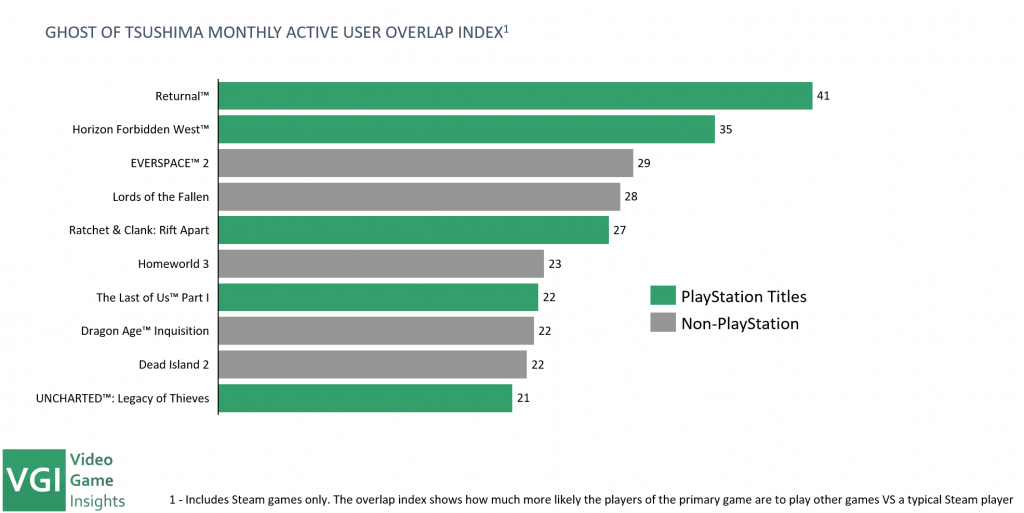
This can be seen quite clearly when looking at the Ghost of Tsushima player overlap
In fact, 5 of the 10 highest overlap indexed games for Ghost of Tsushima are PlayStation titles.
The Player Overlap Index shows how much more likely players of Ghost of Tsushima are to play other games VS your typical Steam player. You can read more about the Player Overlap Index here.
Has the move away from exclusivity and to PC paid off for PlayStation?
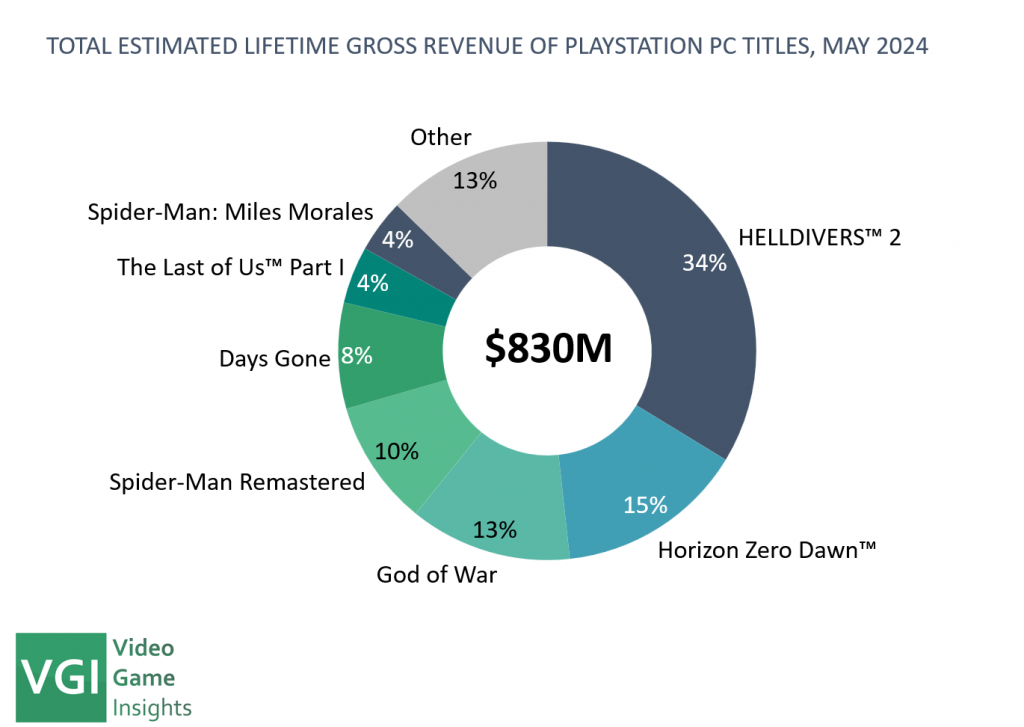
That’s a tricky question. It depends. PlayStation PC titles have generated an estimated $830 million over the last 4 years.
While impressive, this amount pales in comparison to the $29.4 billion generated by Sony’s Game & Network Services segment in FY23 alone. Of course, the G&NS revenue includes first party game sales, physical console sales, PlayStation + subscriptions, and importantly, the 30% cut they take from all sales on PlayStation Store. Still, it’s fair to say that the PC revenues on their own will never be a major segment for Sony’s gaming division.
For a fairer comparison, let’s examine PC sales relative to PlayStation platform sales using Horizon Zero Dawn as an example. Horizon Zero Dawn has sold about 24M units across PlayStation and PC by May 2023. 3.7M of that or c. 15% of total units sold were on PC. However, the PC pricing has been higher (even after Steam cut), given Horizon has been priced at $19.99 on PlayStation for the last 6 years.
We estimate that Horizon Zero Dawn has made approximately $120M on PC to date and around $500M on PlayStation. Therefore, releasing Horizon on PC has resulted in a roughly 25% revenue increase, a substantial boost for minimal effort.
With an estimated development budget of $47M (incredibly low for a AAA game of this quality) it means that the PC port alone has paid for the development of the entire game many times over.
Will PC players convert to PlayStation?
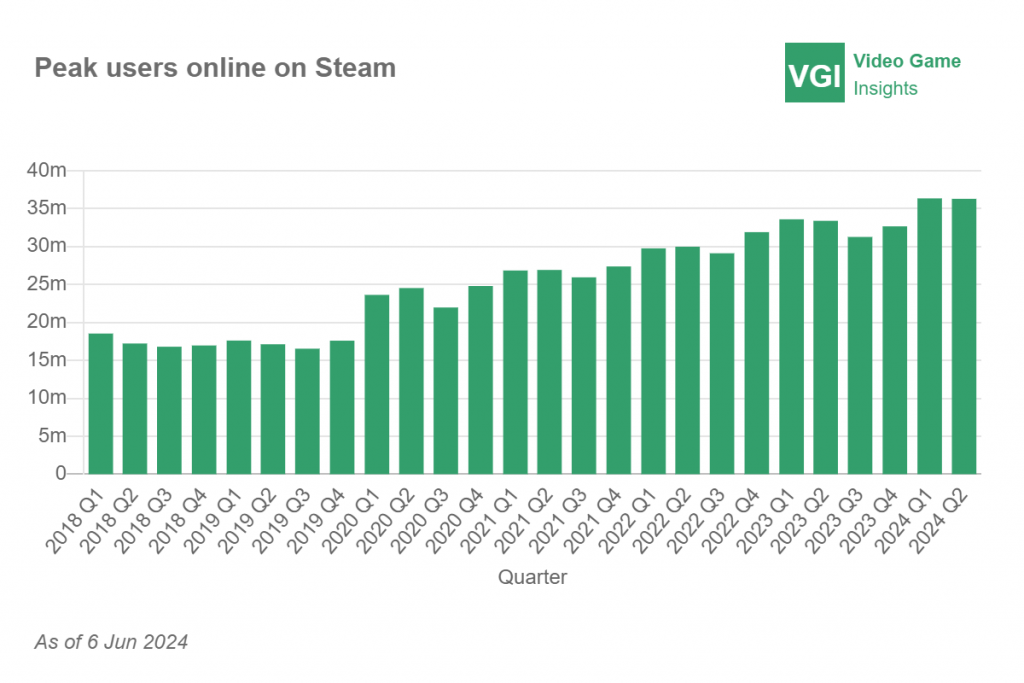
If Reddit is to be believed (and it almost never is), no PC player would ever betray their so-called “master race” and they would never do such an embarrassing thing as to move to PS5. And the truth is, there is a group of hard-core PC players who never will. But this group is getting proportionally smaller. Steam is not a niche platform anymore. There are now over 35 million people active on Steam at any given time, nearly double the pre-COVID numbers.
The majority of these players are not hard-core gamers and die-hard PC fans anymore. The casual and mid-core player mix is growing and that’s exactly the audience that Sony can attract. As the PC player base grows and diversifies, the “PC players don’t care for story-based single-player games” will hold less true. Having these games on PC can arguably also serve an “educational” purpose. How can you learn to love these experiences if you never get to try them?
Breaking down the walls of exclusivity
Other publishers have noticed PlayStation’s success and are announcing similar plans to adopt “multi-platform strategies.” Most recently, Square Enix revealed that they are “aggressively pursuing a multiplatform strategy.” While Xbox games have been available on PC for some time, they are now experimenting with bringing some titles to PlayStation.
In a period of slower industry growth, companies are breaking down barriers in search of new opportunities beyond their existing ecosystems. Gamers benefit from a broader access to high-quality titles, while publishers enjoy increased revenue streams and a larger, more engaged audience.
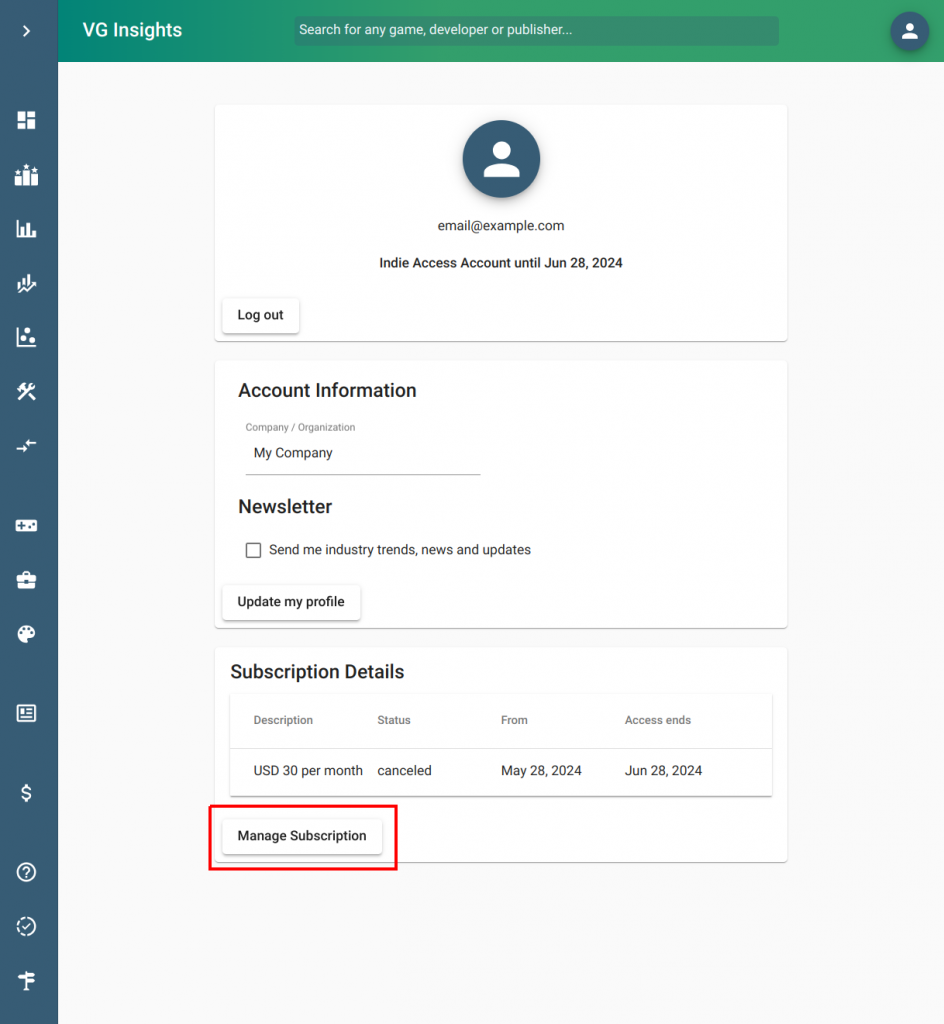
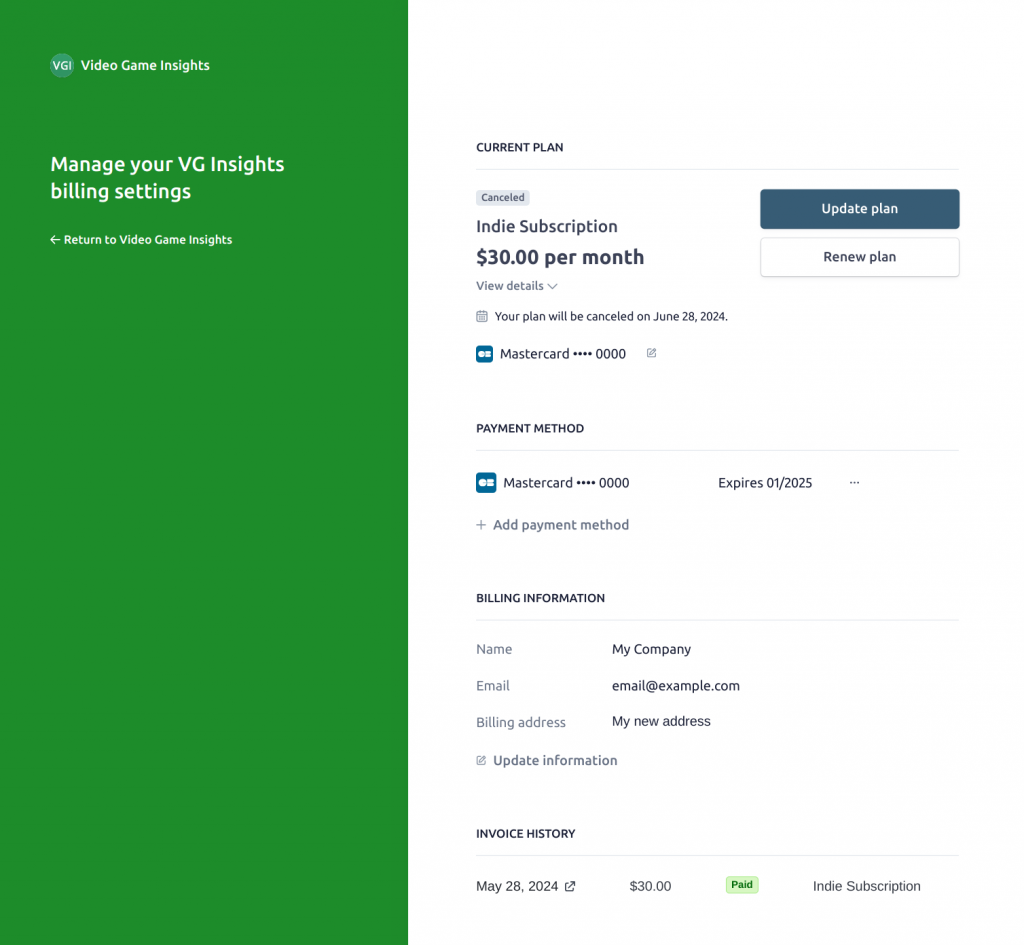
Exciting news: managing your VGI subscriptions is now easier than ever. Our platform integrates with the Stripe customer portal, offering you more control. Access all your subscription needs in one place.
What’s New?
We’ve enhanced how you manage your VGI subscriptions by connecting directly with Stripe. Now, you can access a wide range of options, including:
Subscription canceling: easily end your subscriptions directly through the portal
Changing your plan: switch between the available VGI plans
Viewing invoices: access and download your invoices anytime
Updating Payment Methods: revise your payment information as needed
Managing billing information: quickly make changes to your billing details
This update offers more control and flexibility around your subscription, improving your VGI experience.
We have officially released a long requested feature – Player Overlap. You will now be able to see what other games players play for majority of games on Steam.
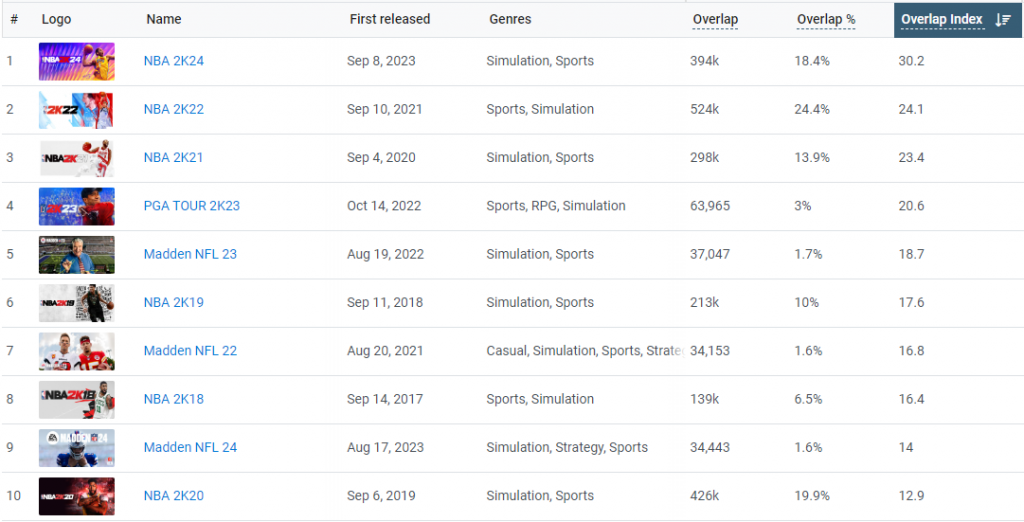
Example: NBA 2K23
Using the example of NBA 2K23, we can now see that NBA 2K players are more likely to also play other NBA 2K games (not surprising). But they’re also 20x more likely to play PGA Tour 2K23 (because there was a bundle c. 1 year ago). Interestingly, they are also much more likely to play Madden than your typical Steam player. That is mostly due to US focused playerbases for both games.
What do these metrics mean and what do I do with them?
Firstly, we’re showing overlap metrics for both lifetime sales (LTD) as well as last month’s active users (MAU).
LTD units sold overlap shows any Steam player who owns both games. MAU overlap shows any Steam player who has played both games in the last 30 days.
Overlap itself shows actual # of people who own both games. Eg 394k people on Steam have both NBA 2K23 and 2K24. Overlap % shows what % of all NBA 2K23 players own other games. Eg 18.4% of NBA 2K23 players have also bought NBA 2K24. Overlap Index, perhaps most important of the 3, shows how many times more or less likely an owner of a game is to play other games. For example, an average NBA 2K23 player is 30x more likely to own NBA 2K24 VS your typical Steam player.
Methodology and Caveats
This is a new feature and still in its Beta phase. We’ve tested it extensively, however, there might still be edge cases to iron out. We’re confident that it is directionally right for majority of games, but we will continue to monitor it and tweak where needed. Note that all of these metrics are estimates based on sample sizes and therefore should never be treated as 100% accurate.
Methodology
Overlap % – We look at a large sample size of Steam players to see what games they play. In the NBA 2K23 example. we look at what % of players of NBA 2K23 in our sample play, for example, NBA 2K24. This is used to calculate the overlap %s.
Overlap – We then apply the overlap % to particular game’s (in this case, NBA 2K23’s) lifetime sales.
NOTE that because of that, the absolute overlap # for NBA 2K23 with NBA 2K24 does not match NBA 2K24’s overlap # with NBA 2K23. However, they are in the same ballpark and directionally similar. This is a fluke of this methodology and we will be looking to improve this going forward.
Overlap index – We take the NBA 2K23 overlap % with NBA 2K24 and divide it with Global NBA 2K24 owners %. In this instance, we know that 18.4% of NBA 2K23 owners own 2K24, but only 0.61% of all Steam players own NBA 2K24.
The Overlap Index is therefore 18.4%/0.61%=30.2
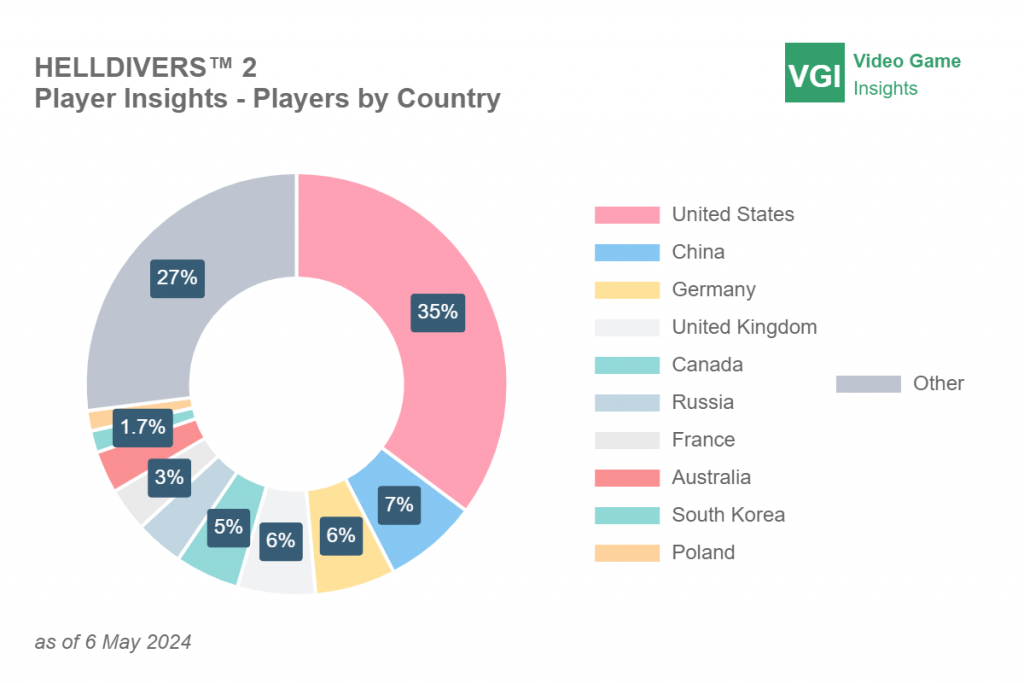
Example 2: Helldivers 2
In this example, we can see that these overlaps also work for very new games. The MAU overlap also exposes how popular games tend to overlap with other recently more popular games. For example, Fallout 4 is the 3rd most popular game to be played by Helldivers 2 players in May 2024 as a result of the recent Fallout TV show success. Other recent release, Content Warning also makes it to the top 10.
Who is this for?
This is a feature currently only for our Business Subscribers.
It’s designed to help larger studios and publishers to better understand their own playerbase. It can be used to optimize marketing targeting, to understand cannibalization and relative market shares between competitive games and to see what type of game elements and features your players might enjoy more.
Reach out to us at sales@vginsights.com to learn more!
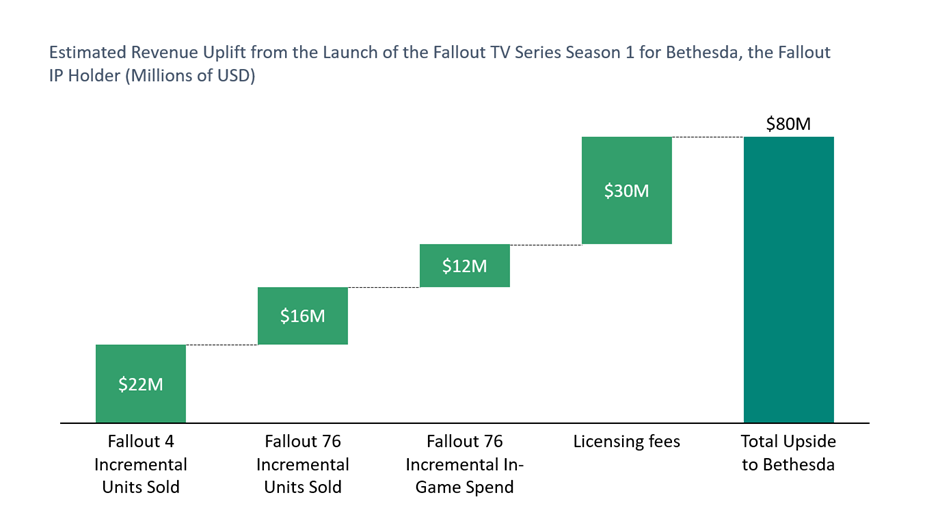
TLDR: The Fallout TV series made Bethesda an estimated 80 million dollars in game-related revenue and license fees with just one season. The TV show revitalised interest towards the franchise, boosting game sales and in-game spend. The potential lifetime value of this to Bethesda, the Fallout IP holder, is hundreds of millions of dollars.
Transmedia is a growing trend in the games industry, though it’s not a new concept. Companies like Disney have long used it, spreading their IP across films, TV shows, comics, toys, theme parks, and video games. Essentially, transmedia maximizes IP value by expanding into new platforms and formats, attracting new fans, and engaging existing ones.
Common types of transmedia involving video games
Book to Game
Some amazing games began as books. The Witcher series, starting as a book by a Polish author, found its first global audience through video games and then expanded further with a popular TV show. The Lord of the Rings and Harry Potter also started as books, moved to TV, and then became games.
Rationale: Some book worlds are so detailed that they can quite naturally be transitioned to games. From a commercial perspective, leveraging an existing fan base mitigates downside risk and there is upside potential to expanding the IP to new audiences.
TV to Game
Another successful example of franchise expansion has been existing TV franchises licensing the IP to video games. Disney has some of the earliest examples of that through Mickey Mouse, but also some of the more recent ones through licensing Marvel and Star Wars IPs.
Rationale: Creating games based on existing TV IPs is unlikely to reach many new audiences. However, it offers an attractive additional monetization mechanism for the IPs targeting younger audiences who are often gamers anyway.
Game to TV
Historically, expanding game IPs to TV has been less successful. Even five years ago, many believed it didn’t work because games are niche, with hardcore audiences, and their interactive nature is hard to translate to film. Examples of failed attempts include Max Payne, Warcraft, Gran Turismo, and Assassin’s Creed, which had potential but fell short commercially and critically.
However, the last 5 years has seen successful transmedia examples. The Last of Us was a masterpiece, loved by critics and audiences alike. Nintendo IPs like the Super Mario Bros Movie and Pokémon Detective Pikachu were commercial hits. Both Dota and League of Legends have released successful anime TV series. Most recently, the Fallout game franchise’s TV series on Amazon was a major success and positively impacted the games.
Rationale: A successful TV show can re-engage existing players (useful for live service games) and expand the market of interested people, offering significant upside for the IP holder by boosting player engagement and attracting new audiences.
The Success of the Fallout TV Series
Firstly, it is important to understand that Bethesda, the game’s IP owner and Amazon, the producer and TV streaming platform owner, are two separate entities that benefit from this TV show in very different ways.
Impact of the Fallout TV series to Amazon
The impact on Amazon is clearer and easier to capitalize on. TV streaming services release content to attract new audiences and retain existing ones. While retaining viewers often means providing a lot of content, attracting new audiences requires big hits like the Fallout TV series.
Here’s what we know about the Fallout TV show viewership:
65M viewers in the first 2 weeks – The Fallout TV show is Amazon’s second most-watched TV show ever, only behind The Lord of the Rings: The Rings of Power.
Mostly watched by 18-34 year olds – Important as Amazon aims to reach new, younger audiences.
60% of the audience from outside of US – Beneficial for expanding Amazon’s primarily US-heavy audience.
It’s clearly been successful for Amazon, even if we can’t put exact revenue or profit numbers to it. What about Bethesda, the IP owner?
Impact of the Fallout TV series to Bethesda
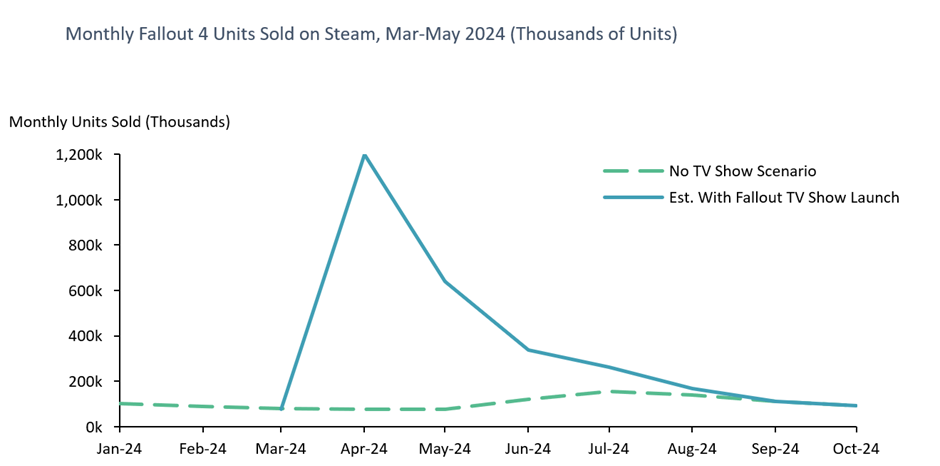
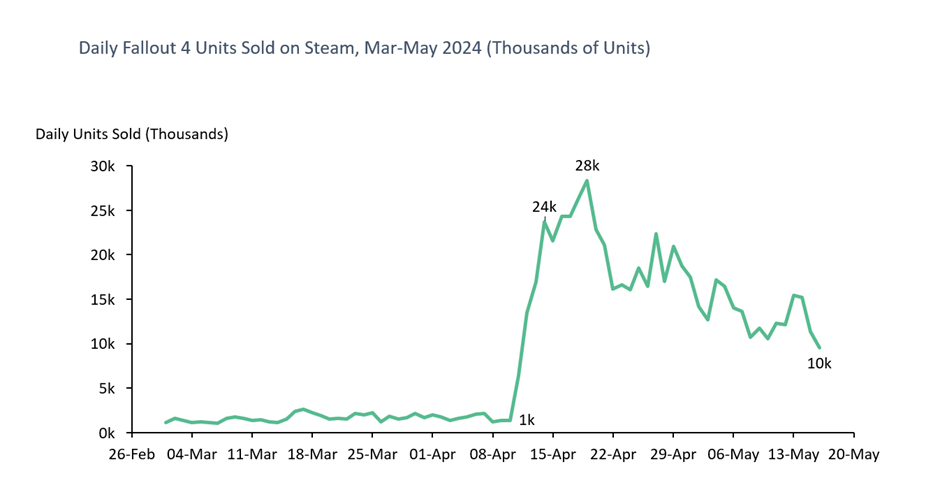
Methodology – Each of the revenue opportunities for Bethesda is calculated by analysing the uplift in Fallout game metrics at the time of the TV show’s launch and forecasting the trend forward to September, when we estimate most of the upside has been realized. We have only considered the impact to Fallout 4 and Fallout 76 here. We don’t cover Fallout Shelter as we lack the data behind it, so we’re likely underestimating the total impact by c. $5-10M. There is additional upside from other games, but at much lower magnitudes. The metrics are estimated using data from the Video Game Insights platform. For Fallout 4 units sold, it looks like this:
Cost – Bethesda likely incurred very little expense, as Amazon probably covered most of the marketing, production, and distribution costs. This means the revenue uplift for Bethesda is almost pure upside.
There are four main revenue uplifts to consider:
Increased game sales – Renewed interest in the franchise boosted sales of existing games.
More in-game revenue – Increased active players for live service games, including both new players and reengaged former players.
Licensing fees – Bethesda was likely paid substantial fees for the right to use the IP.
Expanded audience base – A larger audience base for future game releases.
Here’s what we think the value of each of these buckets looks like:
Increased game sales – We estimate that the TV show will generate an incremental c. 2M Fallout 4 game units sold and c. 1-1.5M Fallout 76 units. That’s roughly $35-40M in revenues post platform fees (taking promotional discounts into account).
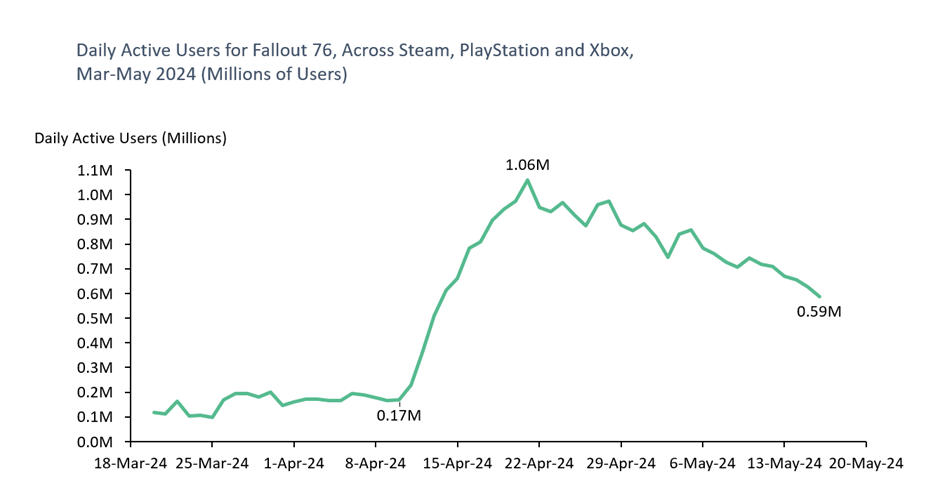
Higher in-game spend in Fallout 76 – Daily active users of FO76 increased from c. 100-200k pre show to peaking at 1M DAU during the show’s launch window across all game’s platforms. This will likely slightly dilute the average revenue per daily active used (ARPDAU) as the new players tend to be more casual. We estimate the increased engagement from old and new players to deliver c. $10-15M in incremental in-game revenues for FO76.
Licensing fees – It is very hard to put a price to that without knowing the details, but typical game and physical goods IP license fees tend to be c. 10-20% of the revenue generated. We also know that Amazon bought the global rights of the Lord of the Rings for $250M or c. 25% of the 1st Season’s budget. Given the $150M budget for the Fallout TV show, it’s not unreasonable to assume c. 20% of the budget was on IP licensing. That would give Bethesda a c. $30M licensing fee.
Overall, the total value from Season 1 of the show that Bethesda will get is likely c. $80 million.
Is $80 million good?
You might think this is a stupid question. However, we’re talking about Bethesda (acquired for $7.5bn), a company that is owned by Microsoft ($200bn annual revenue). In this scale, $80M means a 0.05% uplift to Microsoft revenues, which is ridiculous to think about.
Perhaps that’s not the right comparison though. Let’s compare this to a major AAA game launch like Fallout 4. Fallout 4 sold over $750M worth of games in its first day and we estimate the lifetime earnings have been closer to $1.5bn across all platforms. That’s not atypical for a major AAA title. In this context, the Season 1 revenue uplift of c. $80M to Bethesda is c. 5% of total game sales, still relatively small.
However, this analysis doesn’t consider several factors.
Firstly, we’re only assessing the impact of Season 1. Fallout TV series has already announced Season 2 and it’s likely there will be more to come. So, the impact can be many times that.
Secondly, the series brings a much bigger total addressable audience for future Fallout games. The jury is still out on the actual financial impact of this. However, we bet that Fallout 5 (or 6 or whatever we’ll call it) is going to be planned around one of the Fallout TV show seasons launches.
We estimate that the full value of the Fallout TV series to Bethesda is in hundreds of millions in extra revenue. Importantly, this is a very low risk, low-cost revenue uplift opportunity.
Importance of a well-planned content schedule post TV launch
Bethesda did support the TV show launch with a new patch on PC, Xbox and PlayStation versions of Fallout 4. However, as far as new content goes, it’s really quite little. You could have imagined Bethesda aligning the TV show launch with a major downloadable content (DLC) or, better yet, a new game launch. Fallout 4, the last major single player title in the franchise is almost 10 years old, after all. No doubt they will be doing more to align content with next seasons now that they’ve seen the positive reception.
Transmedia – another buzzword or a real opportunity?
Hater’s gonna hate and hypers gonna hype. Cross-media opportunities provide a low-risk way for game IP holders to boost revenue, though the upside seems capped even in the most successful cases.
We predict many game IPs will be adapted for film and TV in the coming years. With slower growth in the games industry, executive teams will find these opportunities too attractive to ignore.
We have significantly increased the accuracy of our player insights – average and median playtime as well as the country split of units sold.
Increased accuracy – Median playtime and country splits for games are now more accurate across all games
Quicker insights – Playtime and country split metrics used to take 1+ months since launch to be available. They will now often be available as soon as a day after the launch of a new game
Going forward, we will be able to also start showing how playtime and country splits change over time.
This is also a precursor for the long anticipated Player Overlap feature, launching in the coming weeks.
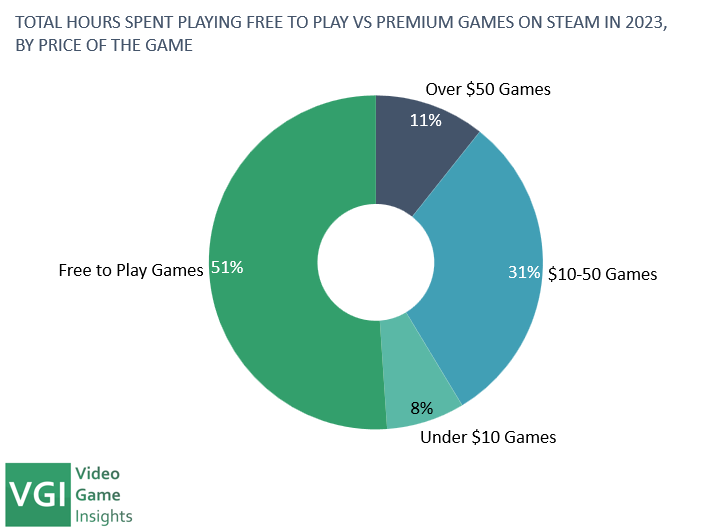
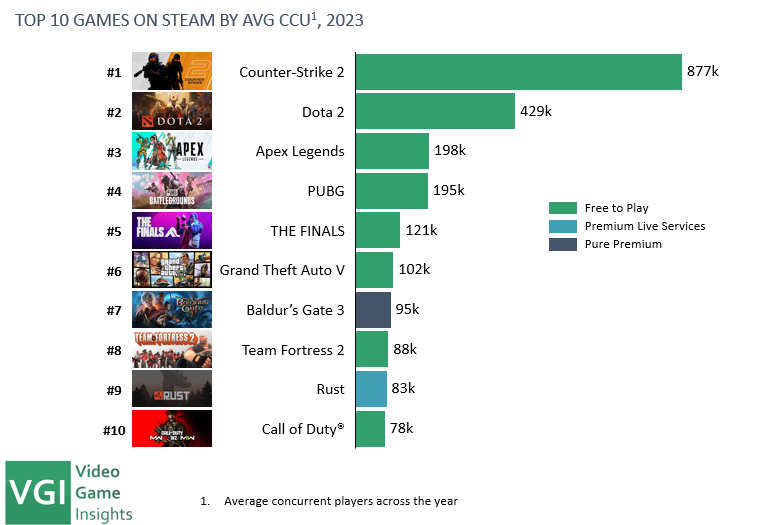
Free to play (FtP) has been a standard in the mobile games industry for over a decade now. In the PC and console world it became a bigger topic around 2017-18 when Fortnite took the world by storm. Suddenly, every large publisher needed to have their own FtP title.
But free to play really started at a meaningful level much earlier, on PC. There are the classics outside of Steam – Runescape (2001), Wolfenstein: Enemy Territory (2003), Silkroad Online (2007) as well as examples on Steam – Team Fortress 2 (2007), DOTA 2 (2013) and so on.
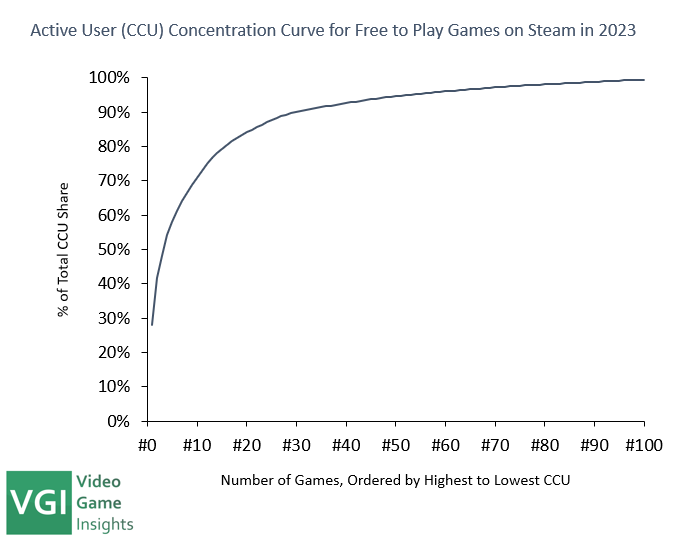
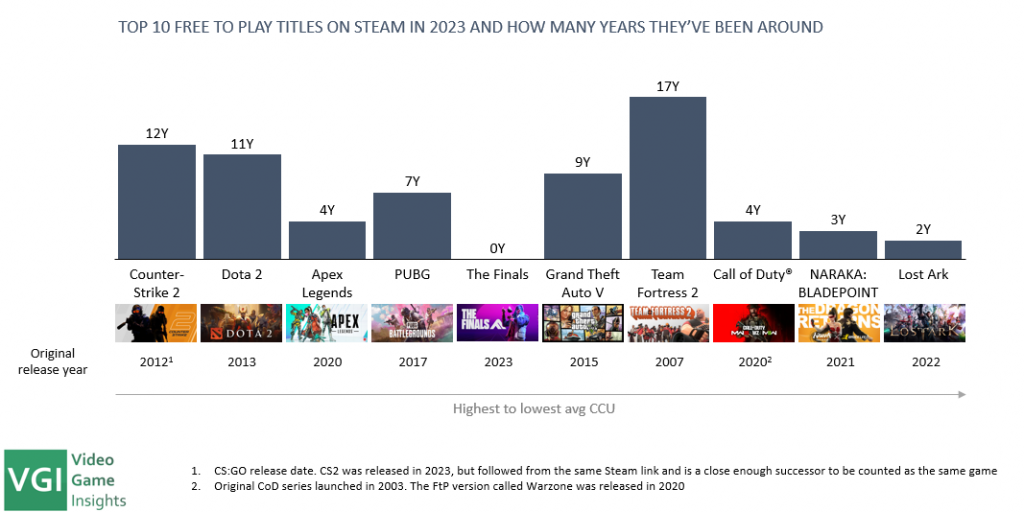
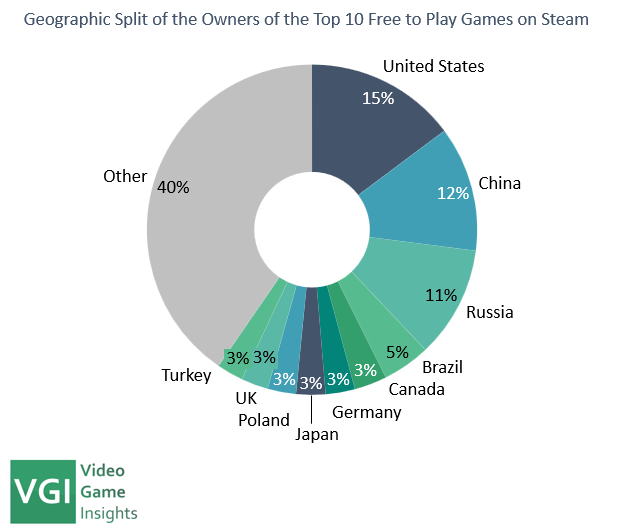
Which brings us to the state of free to play games on Steam in 2024. This report explores the popularity of FtP within Steam and looks at the top games over time.
You’re not going to believe trend number 4! (just baiting you to read the report)
Video Game Insights provides free articles and market reports as well as a comprehensive data and intelligence platform for developers, publishers and investors. Use the menu on the left to explore our tools or search for any game or games company in the search bar above to get started now.