Transparancy of methodology
While reviews have been used as a proxy for sales on Steam for a long time, VG Insights was the first platform to start using more complex review based algorithms – accounting for year or release, price of the game, genre of the game and more. We’ve published articles on our findings in our articles “How to estimate video game sales” and “Further analysis into Steam review to sales ratio“.
In fact, SteamDB, a popular Steam stats website, has used our simple “review multiple based on the year of release” rules to publish their own owner estimate data
VG Insights has now moved on from just using review multiples to include a combination of 4 types of estimations:
- Review multiples – We continue to use review multiples as one source of estimations, but our algorithm includes more complexity behind the scenes, including things like year of release, genre and price of the game
- Sample based – We track a large number of user profiles on Steam, looking at what games they have in their library and what games they’ve wishlisted. This allows us to extrapolate to global estimates.
- Steam top selling games lists – We also use the Steam weekly top selling games lists to adjust our data and make it more accurate, somewhat similarly to how the likes of SensorTower and App Annie estimate mobile games sales
- An algorithm based on our own proprietary data of actual units sold, collected from both public sources as well as through publisher and developer relationships
Testing VG Insights accuracy VS publicly available information
We have collected a sample of press releases and other public data on Steam game sales to compare our algorithm against the real world data. The results are summarised below
Number of games tested: 55
Total units sold tested: 306.7 million
We’ve included every datapoint that we could find through primary research. We’ll continue adding to this list of comparisons as new data becomes available.
Due to the nature of our methodology, we cannot guarantee that it’s a completely unbiased sample size (deciding to publish numbers publicly vs not is inherently a bias creating decision). However, the sample covers a wide range of games in terms of size, genre and release date
VG Insights is only 3% off the true reported numbers at an aggregate level
Firstly, we looked at how well VG Insights performed against the sum of all the reported datapoints
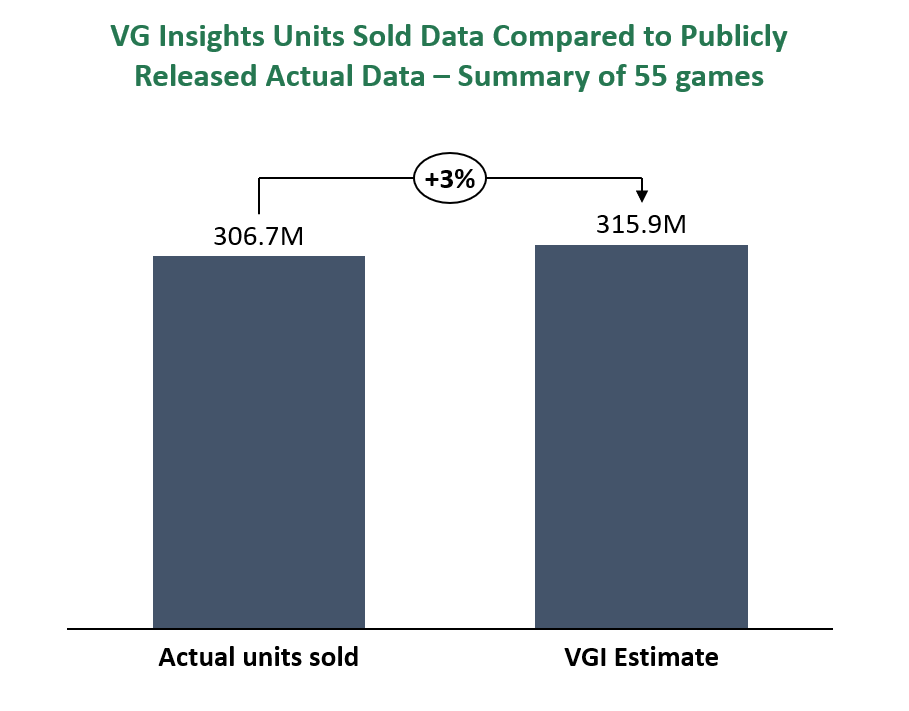
The results are better than anticipated! Even though at individual game level, the accuracy tends to fluctuate more, at an aggregate level, VG Insights’ methdology matches the true reported data very closely
At individual games level, there are outliers, but most games fall in the +-15% margin of error range
Details of individual games tested is highlighted below
| Game | Date | Reported Units Sold | VGI Estimate | % Difference |
| Townscraper | 19/05/2021 | 0.38m | 0.27m | -30% |
| Loop Hero | 12/03/2021 | 0.50m | 0.41m | -19% |
| Valheim | 03/03/2021 | 5.00m | 4.10m | -18% |
| Soma | 16/03/2021 | 1.00m | 0.84m | -16% |
| Black Desert Online | 31/07/2017 | 0.53m | 0.45m | -14% |
| Inscryption | 28/10/2021 | 0.26m | 0.22m | -14% |
| Escape simulator | 04/05/2022 | 1.00m | 0.86m | -14% |
| Kingdom Come: Deliverance | 16/02/2018 | 0.30m | 0.26m | -14% |
| ARK: Survival Evolved | 30/08/2016 | 4.50m | 3.89m | -14% |
| Fall Guys | 11/08/2020 | 2.00m | 1.73m | -13% |
| Total War: 3 Kingdoms | 29/05/2019 | 1.00m | 0.88m | -12% |
| Days Gone | 13/01/2022 | 1.00m | 0.88m | -12% |
| Stardew Valley | 13/04/2016 | 1.00m | 0.88m | -12% |
| Core keeper | 10/03/2022 | 0.10m | 0.09m | -10% |
| Inscryption | 05/01/2022 | 1.00m | 0.91m | -9% |
| Valheim | 19/03/2021 | 6.00m | 5.47m | -9% |
| PUBG | 08/04/2017 | 1.00m | 0.91m | -9% |
| Golf Peaks | 11/12/2019 | 0.002m | 0.002m | -6% |
| Horizon: Zero Dawn | 26/05/2022 | 2.40m | 2.27m | -6% |
| PUBG | 05/09/2017 | 10.00m | 9.50m | -5% |
| Stardew Valley | 01/03/2022 | 13.00m | 12.36m | -5% |
| PUBG | 02/05/2017 | 2.00m | 1.92m | -4% |
| Cogmind | 04/05/2018 | 0.02m | 0.02m | -3% |
| Satisfactory | 05/07/2020 | 0.37m | 0.36m | -3% |
| God of War | 26/05/2022 | 0.97m | 0.96m | -1% |
| PUBG | 27/01/2019 | 42.00m | 41.59m | -1% |
| Fall Guys | 13/11/2020 | 10.00m | 9.93m | -1% |
| PUBG | 21/08/2017 | 8.00m | 8.00m | 0% |
| Loop Hero | 08/12/2021 | 1.00m | 1.01m | 1% |
| Forager | 12/05/2019 | 0.20m | 0.20m | 1% |
| Core keeper | 23/03/2022 | 0.50m | 0.51m | 1% |
| Core keeper | 14/03/2022 | 0.25m | 0.25m | 1% |
| Valheim | 25/04/2022 | 10.00m | 10.23m | 2% |
| The Last Spell | 29/01/2022 | 0.13m | 0.13m | 2% |
| Firewatch | 09/03/2016 | 0.50m | 0.51m | 3% |
| Witcher 3 | 08/04/2020 | 12.00m | 12.45m | 4% |
| Valheim | 20/05/2021 | 6.80m | 7.09m | 4% |
| Dota 2 | 21/11/2020 | 72.00m | 76.37m | 6% |
| Garry’s Mod | 01/09/2021 | 20.00m | 21.21m | 6% |
| Crusader Kings 3 | 17/03/2022 | 2.00m | 2.13m | 6% |
| Mortal Online 2 | 02/02/2022 | 0.11m | 0.12m | 8% |
| Euro Truck Simulator 2 | 01/03/2021 | 9.00m | 9.78m | 9% |
| Terraria | 31/12/2020 | 17.20m | 18.88m | 10% |
| Sea of Thieves | 23/12/2021 | 5.00m | 5.53m | 11% |
| Temtem | 21/02/2020 | 0.50m | 0.56m | 11% |
| CS: GO | 18/02/2015 | 5.60m | 6.22m | 11% |
| The Forest | 05/11/2018 | 5.30m | 5.91m | 12% |
| Rust | 10/01/2022 | 12.00m | 13.50m | 12% |
| Rust | 24/06/2017 | 5.00m | 5.72m | 14% |
| Aragami | 04/10/2019 | 0.32m | 0.37m | 15% |
| Prison Architect | 23/06/2017 | 2.00m | 2.39m | 19% |
| Stellaris | 12/05/2020 | 3.05m | 3.79m | 24% |
| Days Gone | 26/05/2022 | 0.85m | 1.07m | 26% |
| Yes, your grace | 09/03/2020 | 0.03m | 0.04m | 28% |
| Nightmare Reaper | 26/03/2022 | 0.02m | 0.03m | 62% |
46 out of the 55 games tested (84% of games) fell into the +-15% margin of error range. The margin of error is fairly evenly distributed in terms of over- vs underestimation.
There are occasional outliers to out estimates, but these tend to be smaller games and games that have been only recenlty released.
Accuracy of trends
Given our sales estimates are partly dependent on number of reviews, an accurate data reported in real time by Steam, the VG Insights trends in units sold are highly accurate, even for games where the margin of error for point-in-time sales is higher.
Trends are also shown by looking at concurrent players and followers, actual data reported on the Steam platform, increasing the value of VG Insights as a trend monitoring platform.
Continued improvements and transparency
While we can never guarantee complete accuracy of our estimates, we strive to provide the best publicly available estimates
We will continue to refine both our estimation models as well as this data accuracy summary page in order to provide you with transparancey and confidence in our numbers