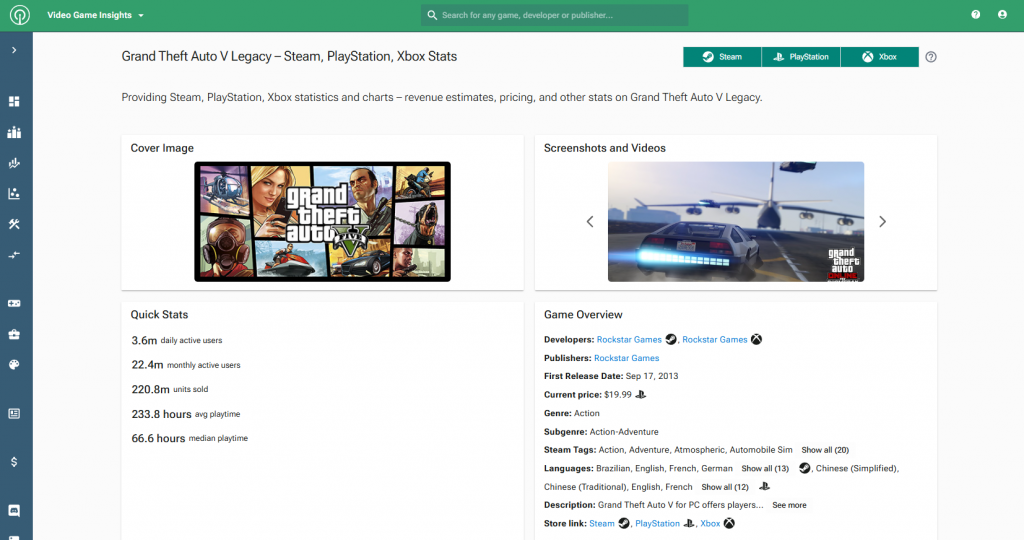
Today is the day we officially launch the VGI PlayStation and Xbox data.
Console insights are updated daily, giving you the most current insights available on the market.
What’s new?
PlayStation and Xbox data almost entirely matches with what we already had available on PC before. You’ll be able to see:
- Performance and Commercial
- Units Sold (Daily basis)
- Prices (Daily basis)
- Engagement
- Daily Active Users (Daily basis)
- Monthly Active Users (Daily basis)
- Player Insights
- Playtime Breakdown (Life to date, updated daily)
- Country and Region Breakdown (Currently PS only. Life to date, updated daily)
- Games Owned Breakdown (How many other games players own on the platform. Life to date, updated daily)
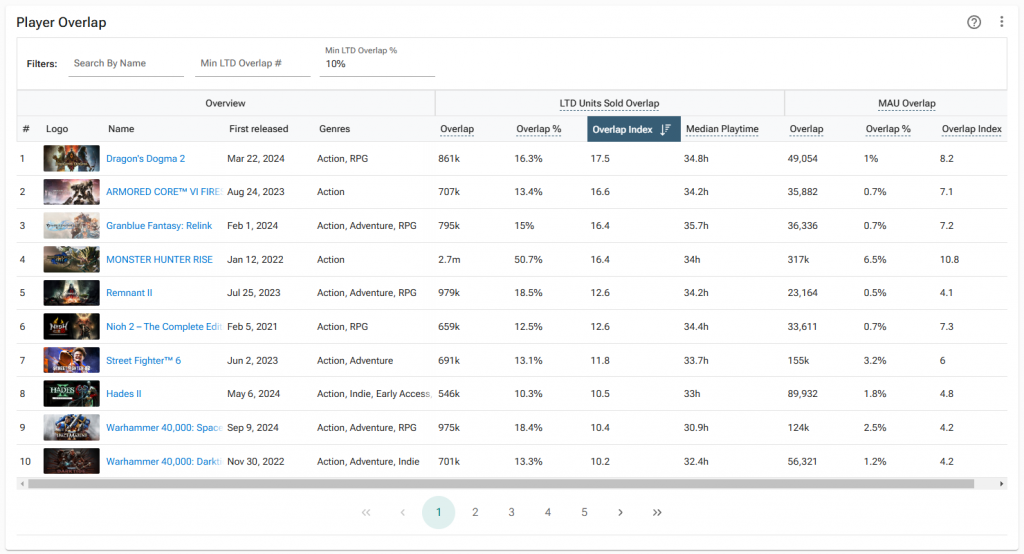
- Player Overlap
- Showing what other games PS and Xbox gamers are playing. % overlap, overlap index, MAU overlap etc – fully replicating Steam optionality.
- Reception
- Rating (Daily basis)
- Number of Reviews (Daily basis)
- Metadata
- Developer and publisher information
- Release dates
- Genres & subgenres
- Game engine
On top of that, we have released a new genre taxonomy which you can read about here. It unifies our games across PC and console and provides a consistent taxonomy going forward.
How can I access it?
The PlayStation and Xbox data is available as a new product add-on
Ready to see the data for yourself? Request a demo or contact your Sensor Tower Account Director!