We’re excited to announce that we are now part of the Sensor Tower family. This acquisition will allow us to significantly boost our platform offering and the speed at which we can deliver new features to our clients. Our combined gaming intelligence solutions will include PC, Console and mobile insights, providing customers with an unparalleled view of the gaming landscape.
🚀 Video Game Insights will now operate as “Video Game Insights by Sensor Tower.” 🎮 Click here to read the full announcement
We will release a lot more information about our future plans in the following weeks. Stay tuned!
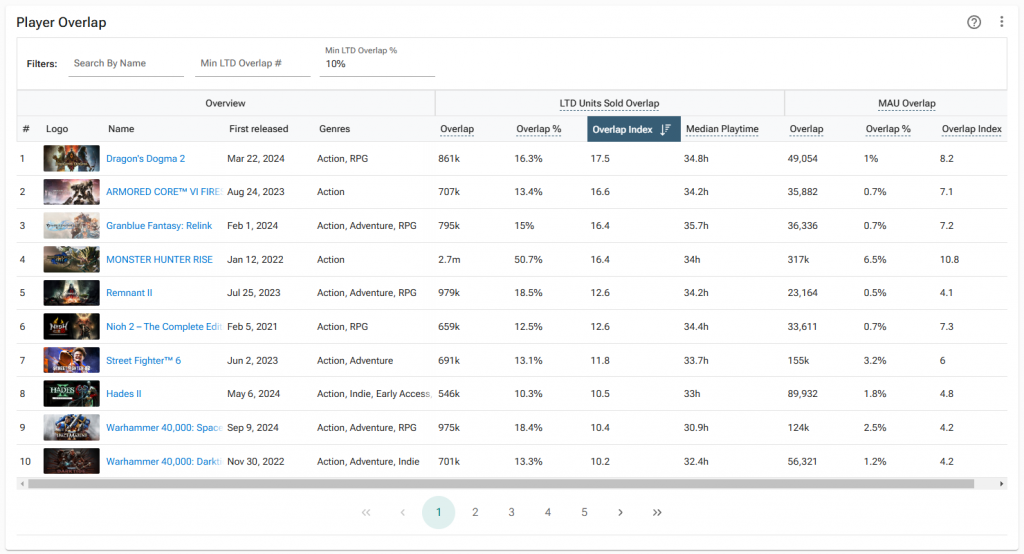
This update comes with a bunch of smaller bug fixes and visual updates. However, the bigger new feature allows you to now filter the Player Overlap tool in a better way.
You can now easily combine the power of overlap % and overlap Index. For example, you could only look at games with at least 10% overlap and sort by overlap index. This would result in only larger games being shown, but still ordering by their relative persona preference.
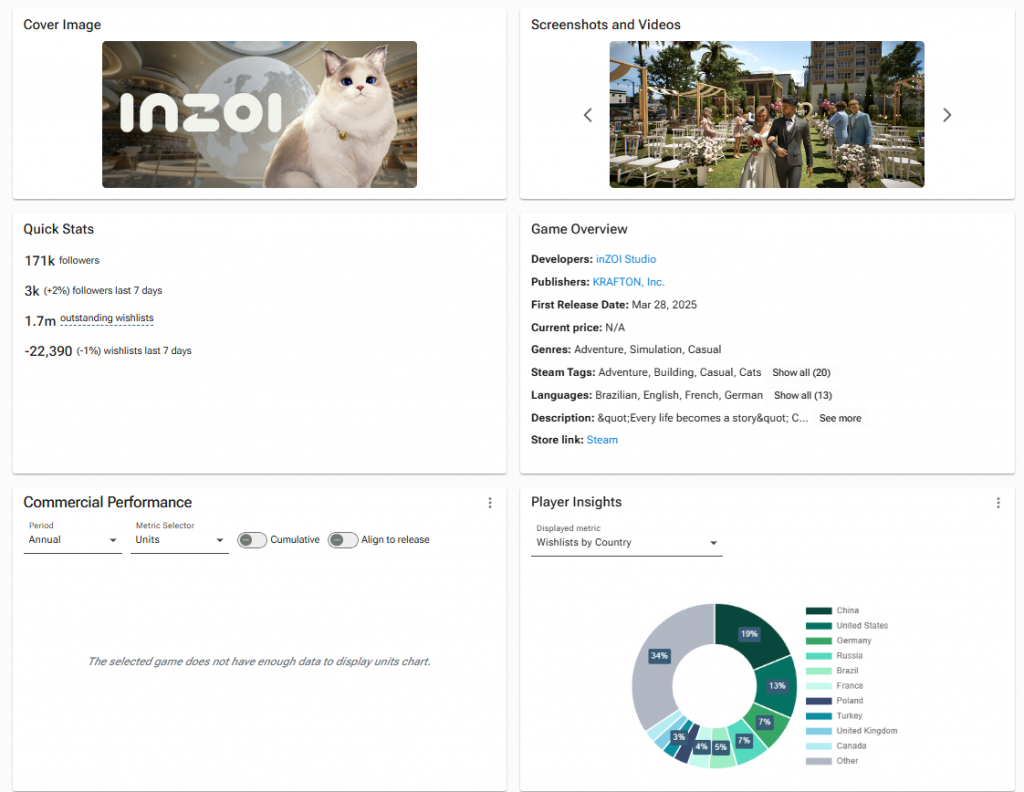
We are now showing wishlist breakdown by country estimate for unreleased (and also released) games! You can now see where the interest towards a game is coming from.
We have added a couple of much requested features to the paltform recently:
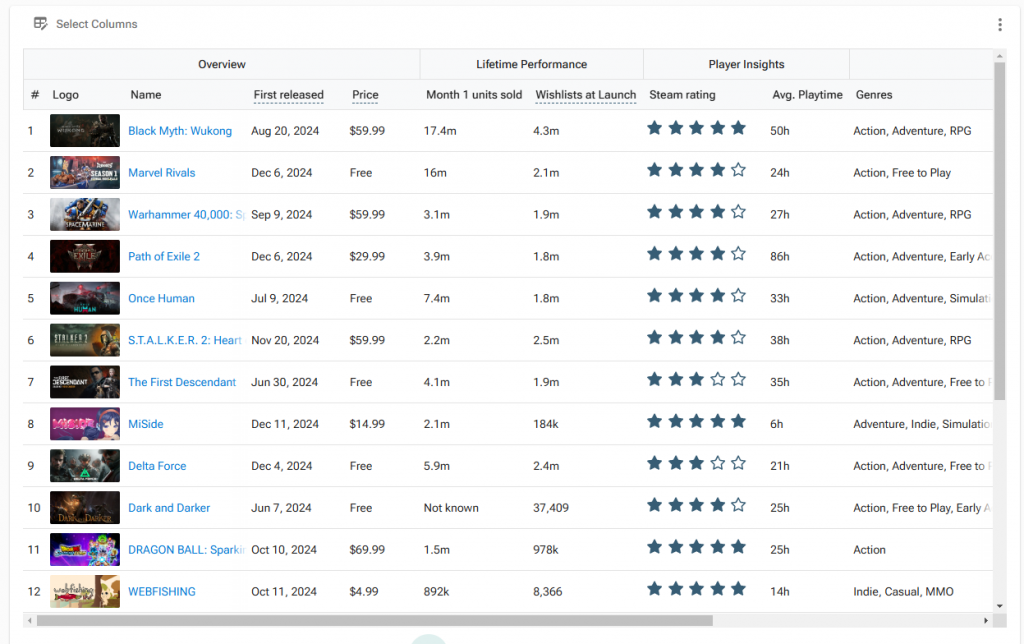
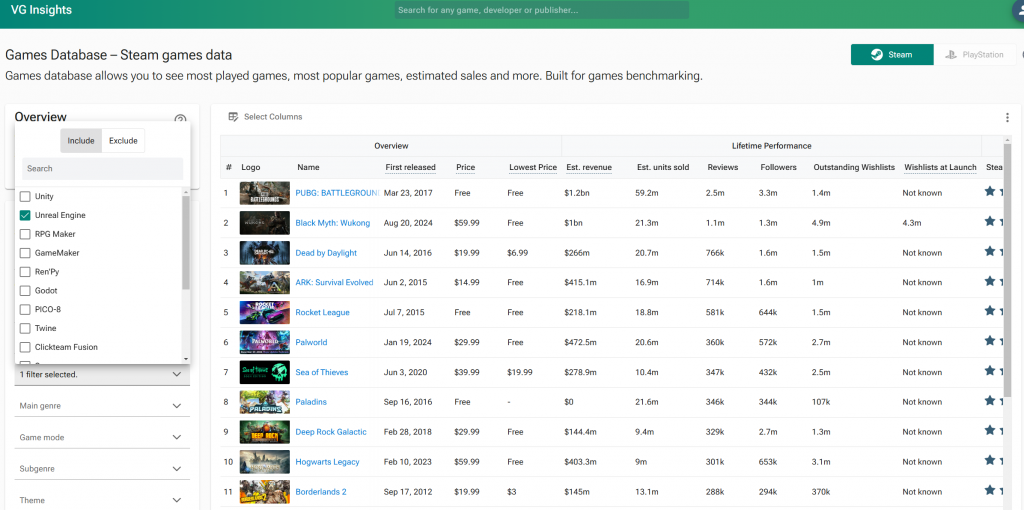
Month 1 and Year 1 units sold on Games Database
We’ve added 2 new columns to the Games Database – Month 1 and Year 1 unit sales. This allows you to have quick like-for-like comparison for launch performances.
Not only that, you can use these together with our “wishlists at launch” metric to get a better understanding of the wishlist to launch conversion ratios for the games you care about.
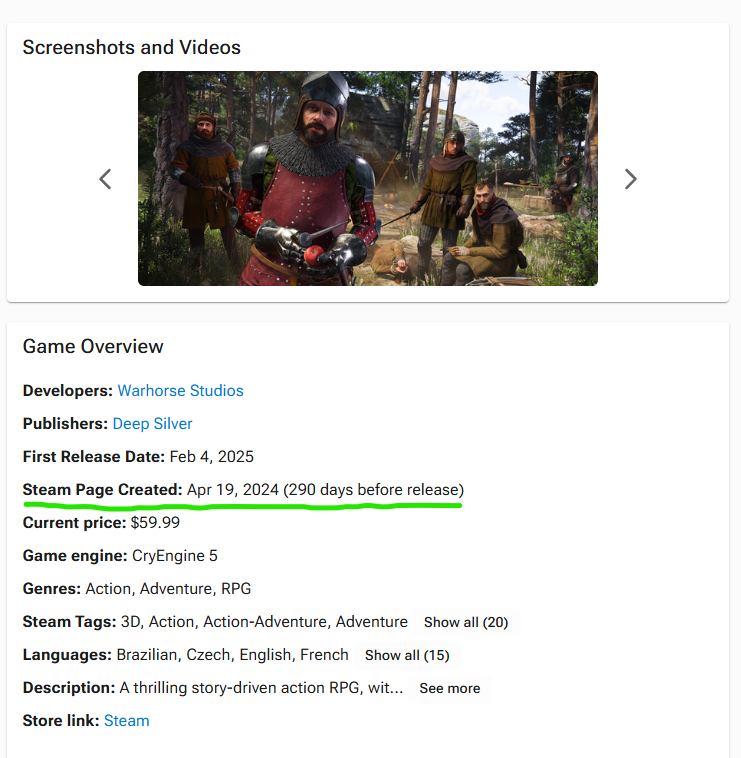
You will be now able to see when the actual Steam Store page was created for majority of games, including how long it took them to get from Store page creation to launch.
This is a super useful metric for understanding how to optimize the Steam page and how early other games release their Steam pages pre launch.
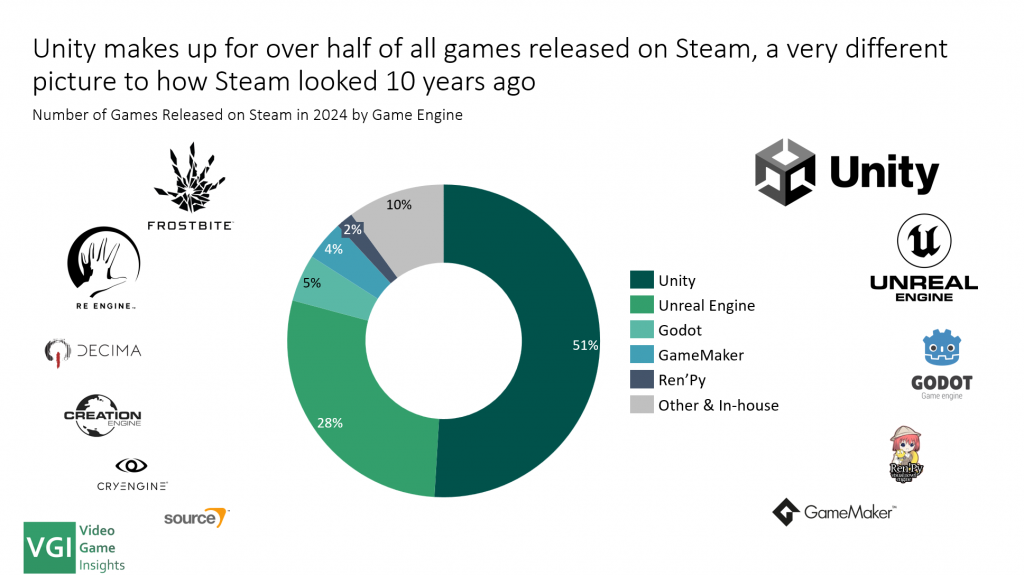
Video game engines have evolved significantly over the past decade. While mobile game development has long been dominated by third-party engines—most notably Unity—the same was not true for PC and console games.
Until recently, the majority of large titles were developed using in-house, custom-built engines. Not anymore.
This report covers:
– State of game engines today – Game engine market share trends over time – Forecasting the future trends – Did Unity’s pricing debacle impact market share? – The growth of Unreal Engine – Is Godot really winning share? – Game engine shares by sub-genre of games
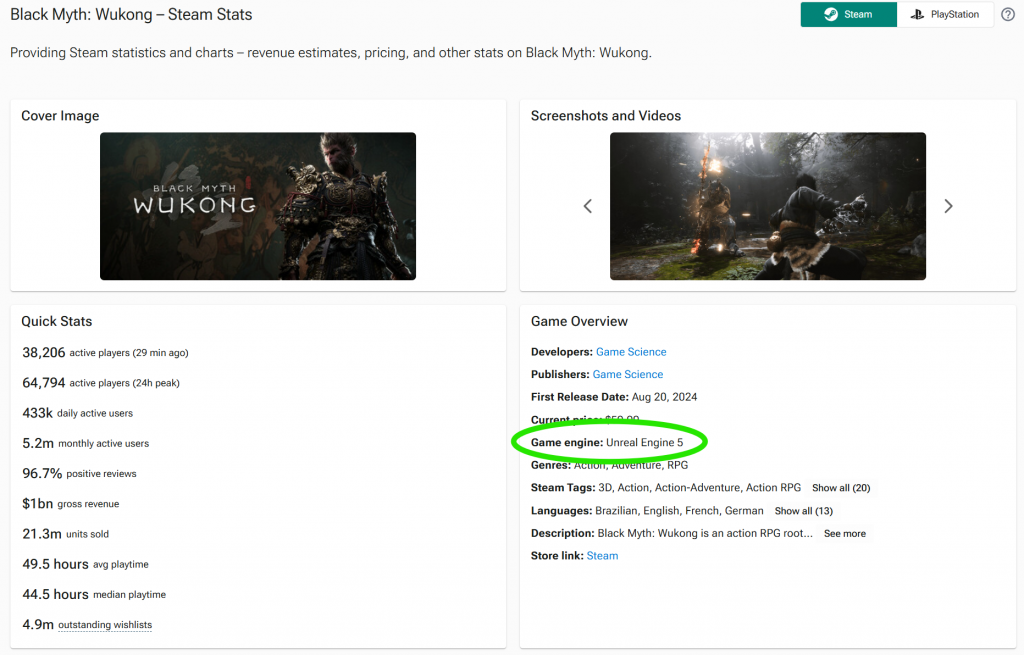
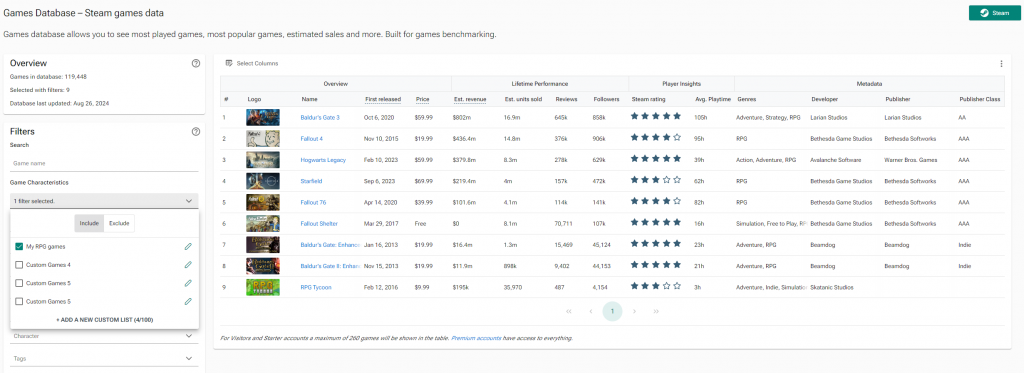
We have just added game engines as a datapoint to all games. As a business subscriber, you’ll be able to see the game engines for most games with >10k sales.
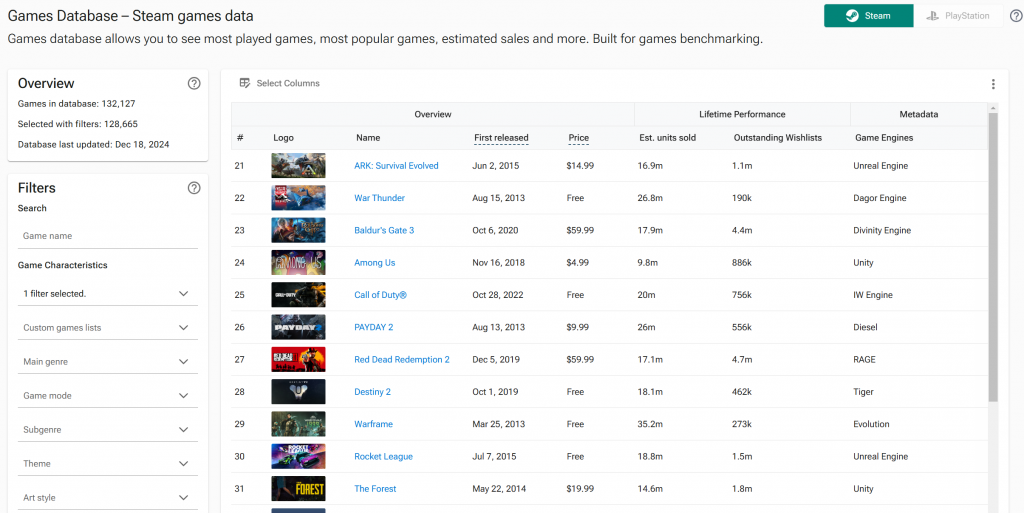
Business subscribers will also be able to see game engines as a separate column in the Games Database.
You’ll also be able to filter games based on the engines!
Our wishlist estimates have been the best in class since we launched them back in March. Well, they’ve just got a bit better. We have had to tweak our methodology slightly and this has resulted in even smaller variance VS actual numbers in our internal checks.
Key changes:
Some games weren’t tracking wishlists properly before and they are now
Some games’ wishlists were overestimated before where we’ve now fixed that bias
This impacts all wishlist numbers we show. We encourage you to update any analysis that relied on the old numbers.
Note that we try and keep any large scale estimation changes to a minimum, but in order to provide you with the best estimates possible, we do occasionally need to make these changes.
We will make sure to give a heads up in the future rather than report any changes retroactively.
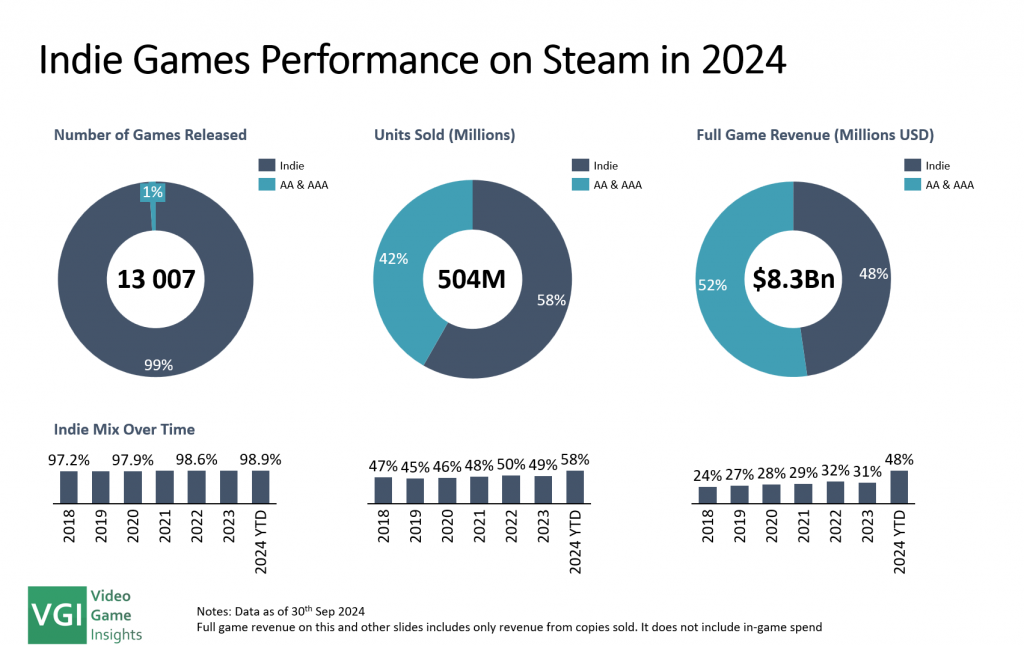
The global indie games market has hit new heights in 2024. Our Global Indie Games Market Report 2024 offers an in-depth analysis of the indie game landscape. Discover key data on market growth, top-performing games, and trends shaping the future of indie gaming.
Indie Games Now Rival AAA Titles on Steam: For the first time ever, indie games are generating as much revenue as AAA and AA titles on Steam.
Top Indie Game Releases of 2024: Black Myth: Wukong and Palworld have set new records, with tens of millions of units sold.
Growth of the Indie Market: Indie games sector has grown every year since 2020 despite the wider industry slowdown.
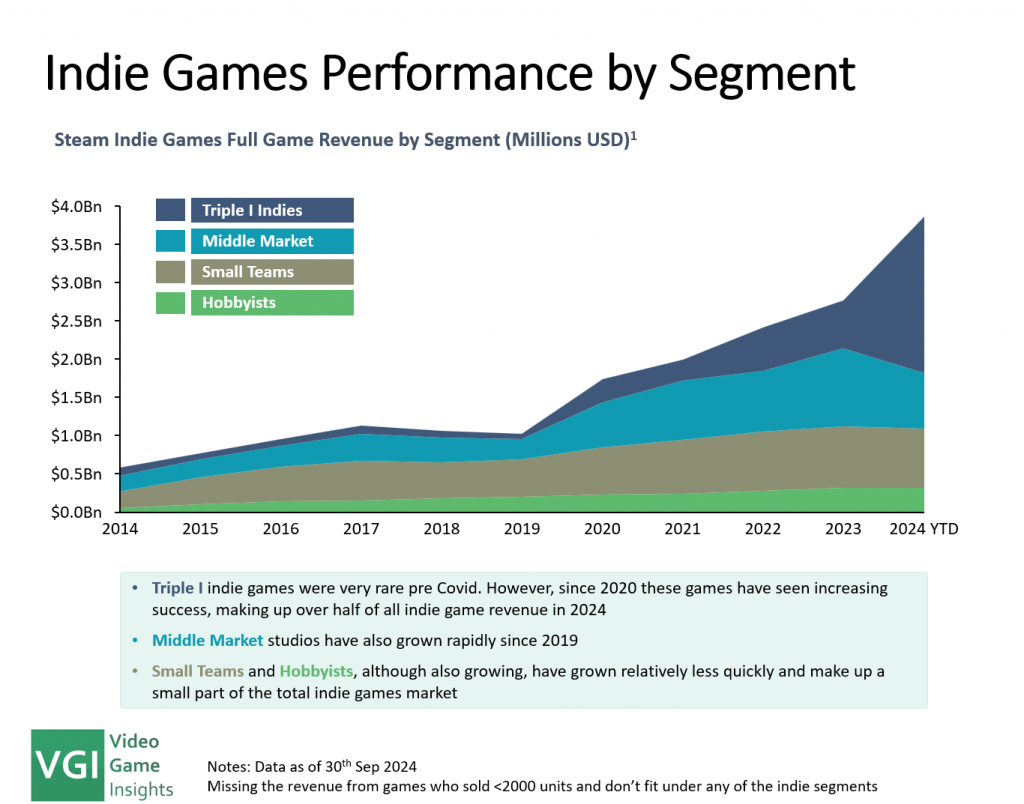
Segmenting the Indie Market: Indie market splits into Triple I Indies, Middle Market, Small Teams, and Hobbyists. Each segment has seen unique trends in the last 4 years.
Indie Studios are Maturing: More studios are releasing their 2nd or 3rd games, with experienced developers seeing better financial success with each release.
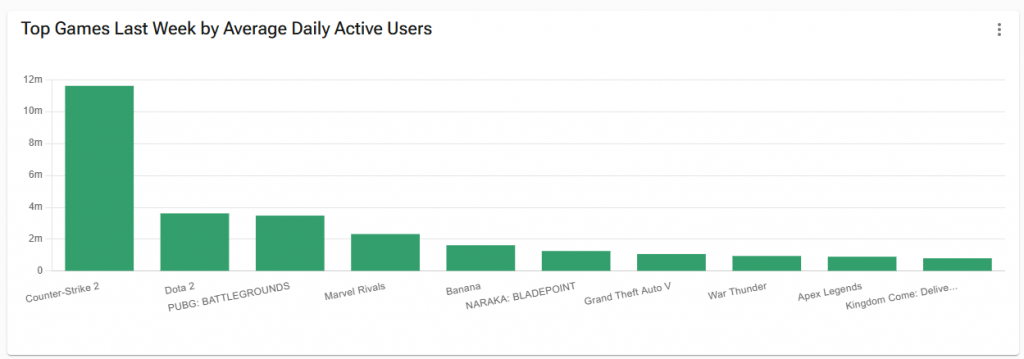
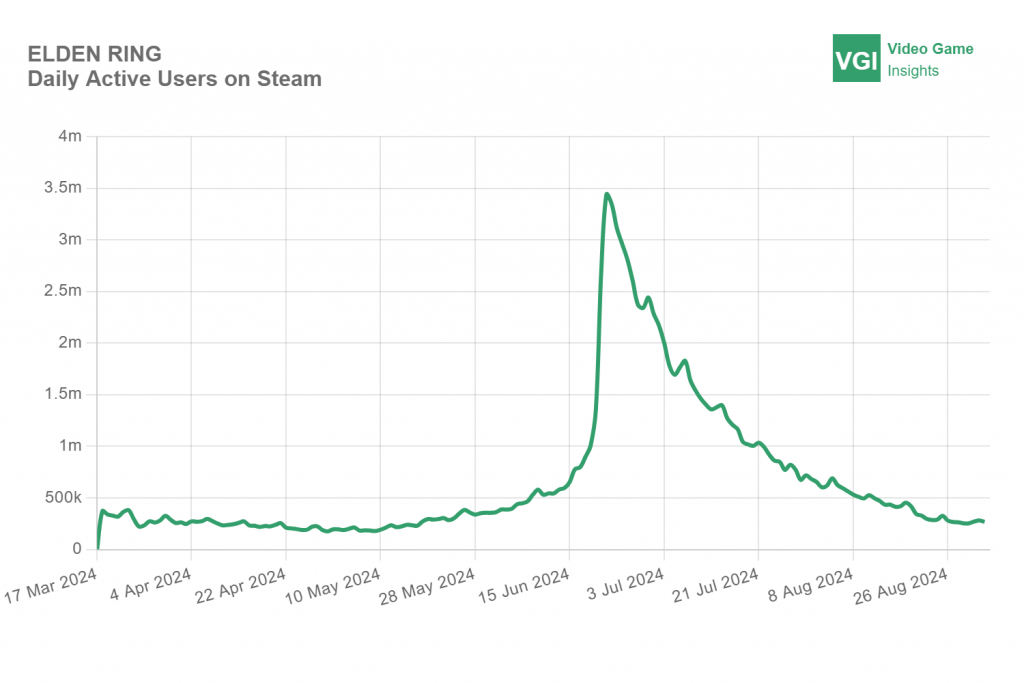
We’ve just released our estimates for daily active users (DAU) and weekly active users (WAU) for Steam games.
You’ll be able to see these metrics for any game with at least 100k units sold by going on their individual games page and using the “historical data” section.
Note that these metrics do tend to give a highly correlated view to the much used concurrent users (CCU) metric on Steam. However, DAU and WAU are much more used in corporate environments and serve as a more practical input for most modelling purposes.
Additionally, the DAU metric sets us up for the upcoming PlayStation data where you will be able to start comparing PC & PS DAU metrics and see what the platform mix looks like for multi-platform games.
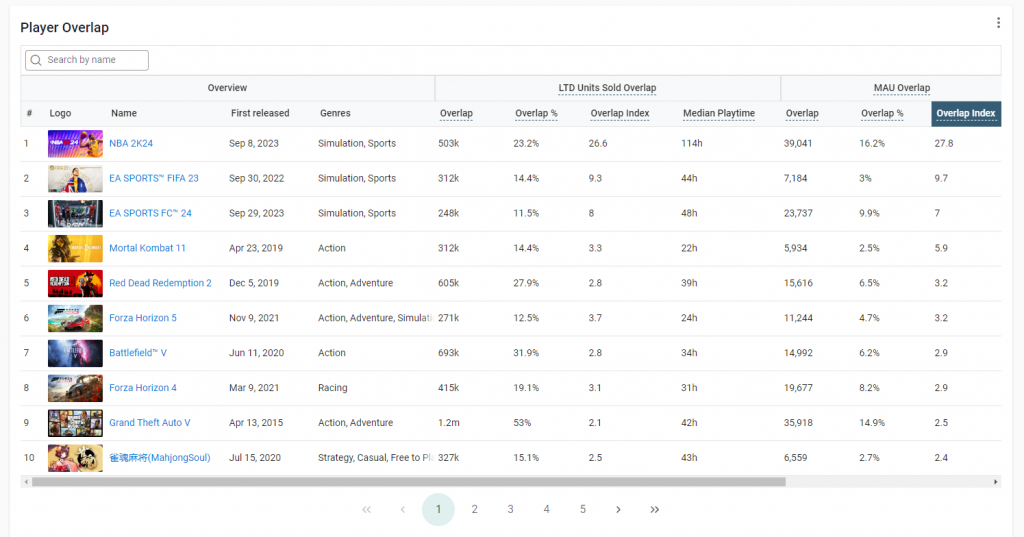
We’re excited to roll out a cool update to our Player Overlap feature, now with even more detailed insights into player behaviour.
What’s new with player overlap and what can you gain from it?
Using NBA 2K23 as our example, let’s explore a part of this further, just like we did in our last post about this feature.
Median Playtime: reveals how many hours a typical player dedicates to NBA 2K23, based on what other games they play. You’ll find this data for all games in the “LTD Units Sold Overlap” section of the table. So you can now not only see what else players play, but also how dedicated they are to the main game in focus. For example, people who bought NBA 2K24 spent over a hundred hours in 2K23 while people who play games like Forza or Battlefield tend to be more casual NBA 2K players.
We’ve also introduced wishlist-related metrics for more depth, available only for unreleased games. Learn more about them below:
Wishlist Overlap: Looks at players who wishlisted the main game in focus and what else they’re playing on Steam.
Wishlist Overlap %: Indicates the percentage of main game wishlisters who play other games.
Wishlist Overlap Index: Measures how much more likely main game wishlisters are to play another game compared to the average player. A value of 0.5 means half as likely, while 2.0 means twice as likely.
These new metrics offer our Business subscribers deeper insights into player behavior, helping refine marketing strategies and uncover market opportunities.
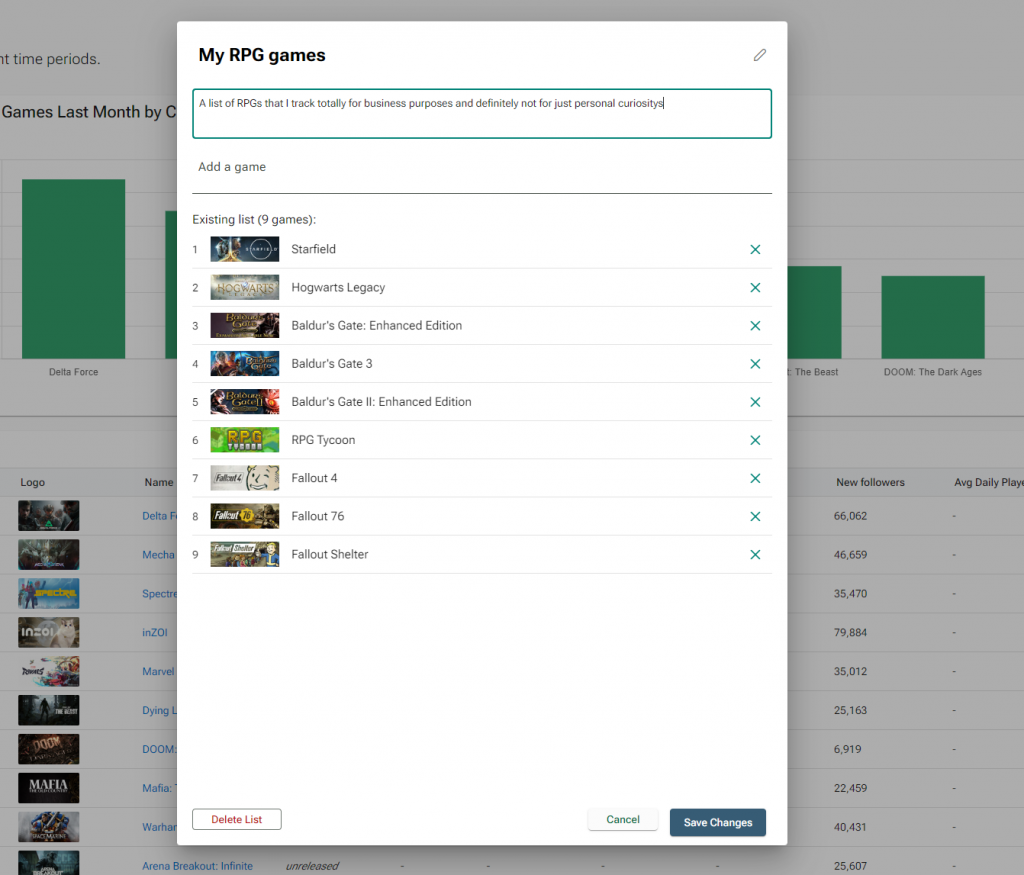
Custom Games Lists
Do you have a specific list of games you’d like to track or summarise data for? Well, now you can (finally)!
Indie and Business subscribers are now able to set up custom lists with whatever games they’d like. These lists can then be used on any page with filters (Games Database, Top Charts, Steam Analytics etc).