- Release year – Recap on how important release year is
- AAA VS indie games – Do indies have a different ratio to big budget AAA games?
- The game’s price – Should higher priced games have a higher or lower ratio?
- Positive ratings % – Do negative or positive reviews have an impact to the ratio?
- Number of reviews – Are bigger and more popular games likely to get reviews?
- Genre – Are some genres more likely to get reviews?
Recap of the rule of thumb Steam reviews to sales ratios
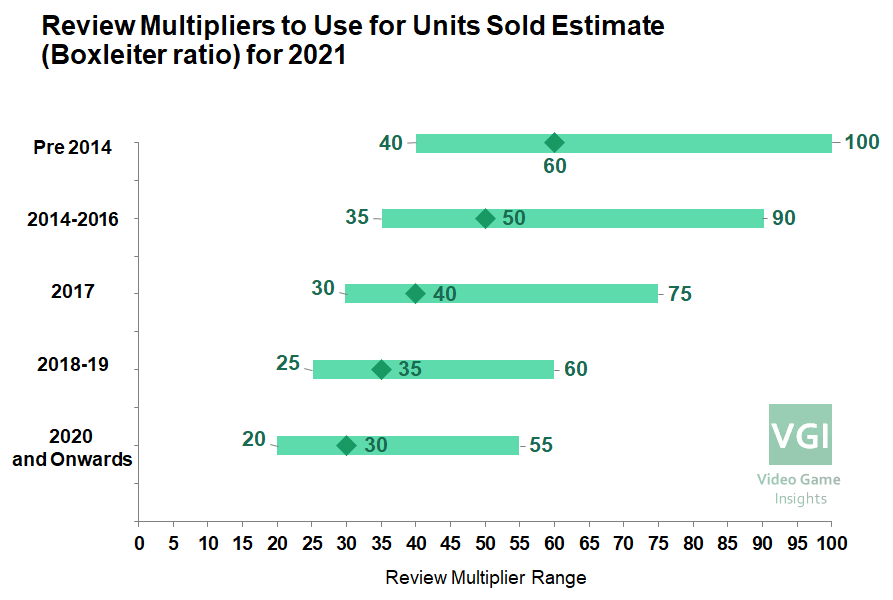
In our previous article, we talked about the right ratios to use based on the game’s release year. This is still the most important element. If nothing else, use the ratios in the graph below and you’ll get the right ballpark for most games.
In this article, we’re exclusively using the leaked 2018 dataset of game sales and scraped reviews to match the sales numbers. This covers over 13,000 games. We’re not adding any additional data to keep the data as comparable as possible.
The data will be presented in the format below. We’ll show the distribution of sales ratios based on release year, price etc. We’ll also show how the median Steam review to sales ratio changes. Finally, we’ll present the ‘tail’ numbers – what % of games of that criteria have review to sales ratio of over 200?
The review to sales ratio to use based on the release year of the game
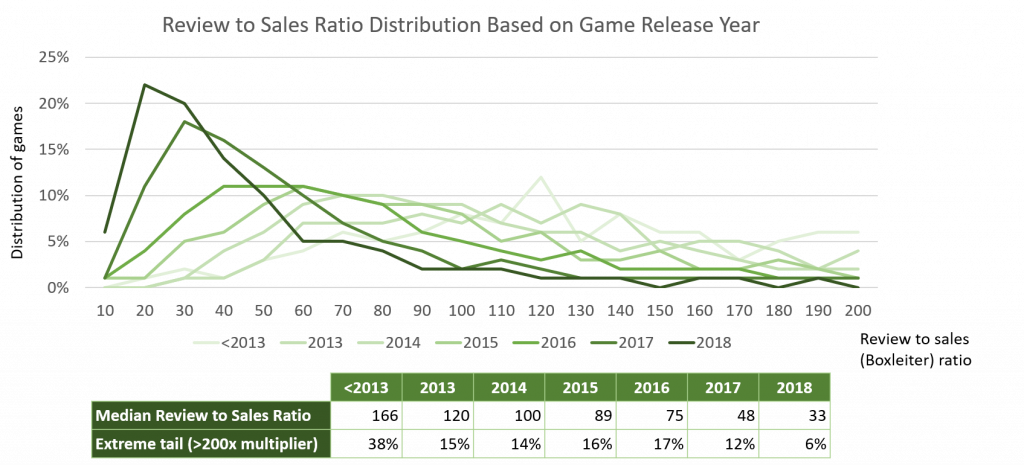
The review multiples have come down significantly over time. Median reviews in 2018 were only around 33 while they were well over 100 five years earlier. Not only that, the ‘extreme’ multiples have almost disappeared. Almost all games are now below 200 ratio.
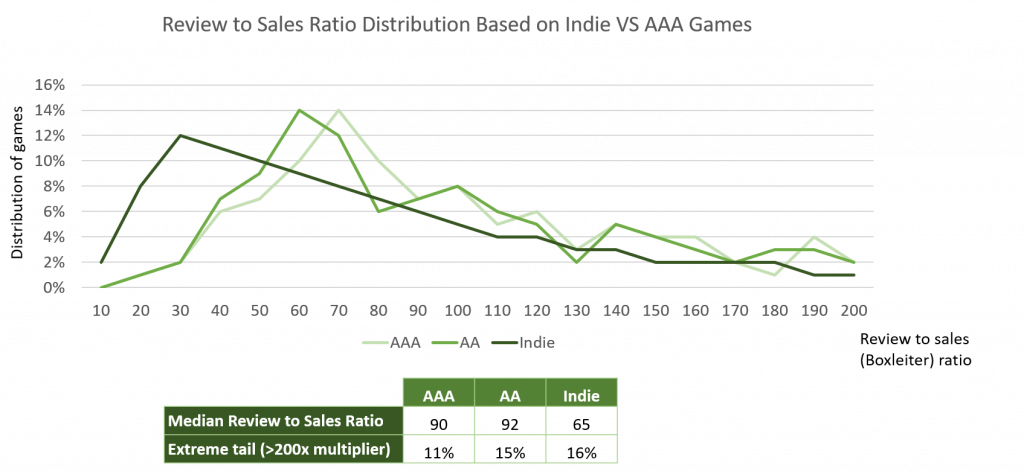
Large budget games have higher review ratios
The median Steam reviews to sales ratio is higher for AAA and AA games than for indies. Essentially, this means that indies are more likely to receive reviews from players.
This makes sense. Indies have less sales, on average, so the ‘friends & family’ reviews have a higher weight. They’re also more likely to be passion projects and have unique features – reasons to leave a review.
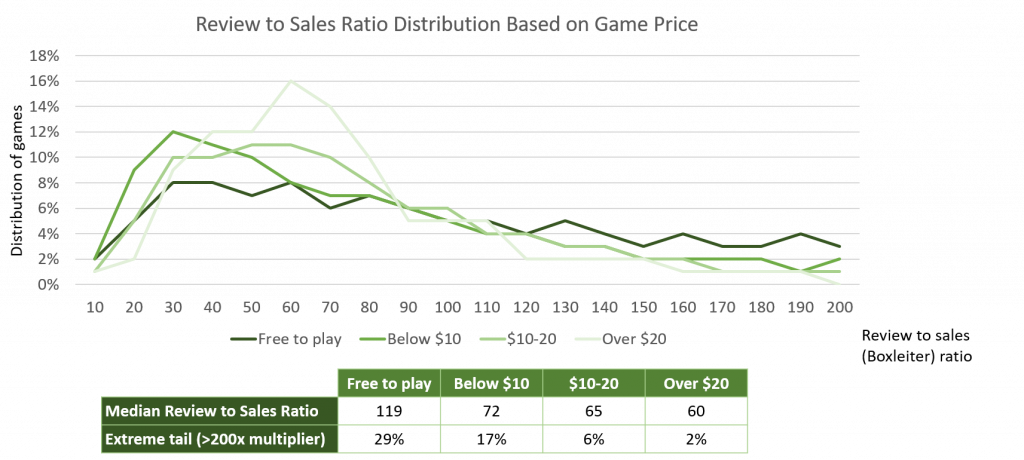
Higher priced games have more accurate estimates and higher multiples
The main takeaway here is that free to play games are very hard to estimate. Almost 1/3 of the games have extremely high (>200) multiples and the rest are also all over the place.
For paid games, higher priced games have lower tails. Median sales ratio is c. 60 for games priced at over $20. Essentially, we can be more confident in estimating higher priced games.
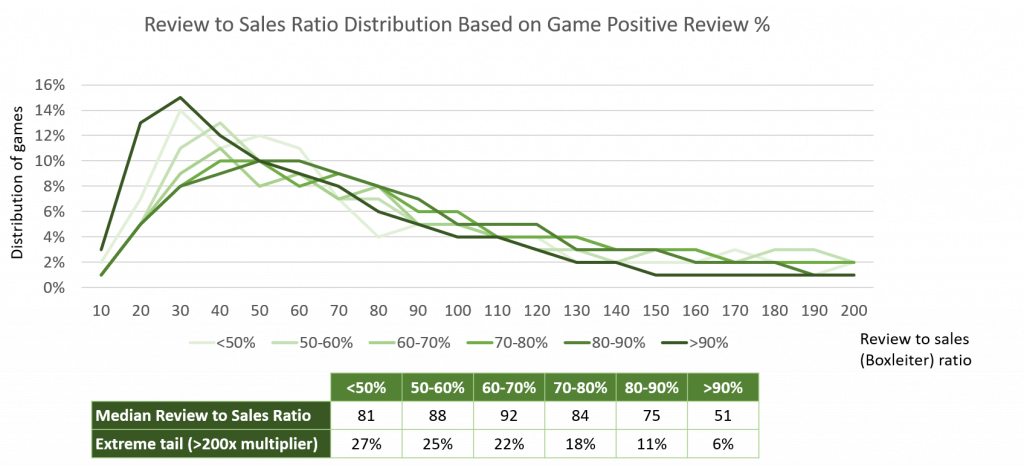
Better rated games have lower review to sales multiple and more accurate estimates
Similarly to price, games with higher ratings tend to have higher estimation accuracy and lower ratios. Basically, the more likely people are to leave a review after playing, the easier and the more accurate it is to predict sales based on reviews.
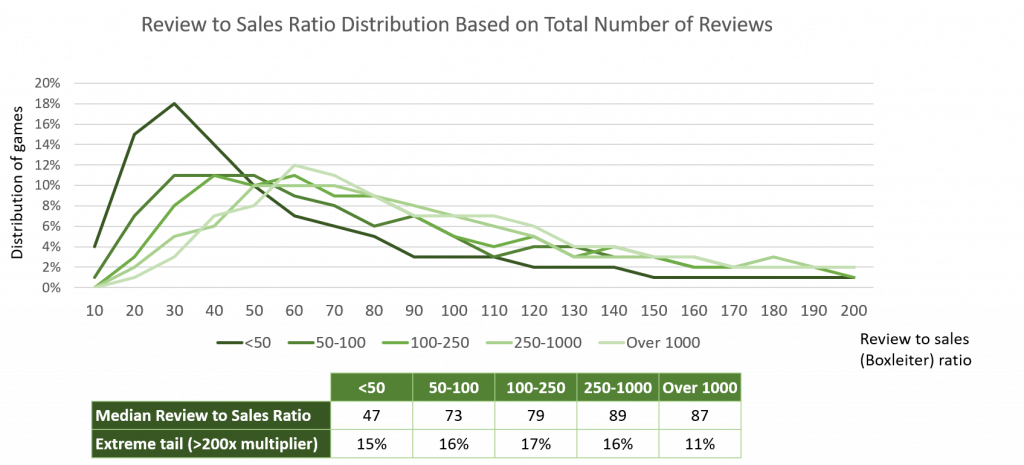
Games with low number of reviews tend to have low multiples; more popular games have the most accurate estimates
Games with more reviews tend to also have higher estimation accuracy and lower Boxleiter ratio.
You can see a trend starting to appear across the different variables we’ve explored so far. Bigger, higher budget, better rated games tend to have higher estimation accuracy. They also tend to have lower ratios – a higher proportion of buyers leave a review.
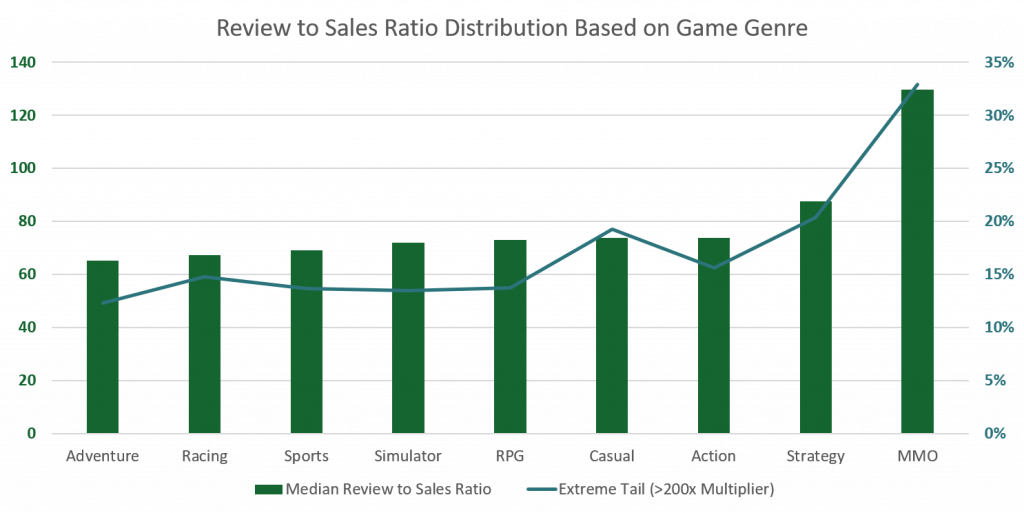
Genre typically does not make a difference, with the exception of MMOs
The only outstanding genre in terms of ratios is MMO – typically free to play games with much higher review to sales multiple. This is mostly explainable with the elements observed above. A lot of people play MMOs just to try them since they’re free and never leave a review since they’re not invested enough.
It is surprising though, how similar the ratios are across genres. This means that people playing sports or racing games aren’t much different to people playing RPGs in terms of their willingness to leave a review.
Statistical significance
It’s worth mentioning that only year of release, price and % of positive reviews are statistically significant when looking at a simple linear regression VS the Boxleiter ratio. Genres and total number of reviews show a trend, but not at a high confidence interval.
Summary
It’s much more accurate to use the Boxleiter method on bigger, higher priced, better rated games. For smaller games, especially games released pre 2018, the estimates can be less accurate. That being said, the ratios range is fairly narrow for games released in 2018 (and later).
If you’re using review to sales ratios on games newer than 2018 or on larger, better rated games, good stuff. If you want to estimate the sales of a niche games from pre 2018, be careful and adjust according to the graphs above.
If you found this insightful, you might want to check out more games industry trends on our free Steam Analytics platform or explore data on any individual game or publisher!