Categories
Updates

More Player Overlap Metrics and Custom Games Lists

We’re excited to roll out a cool update to our Player Overlap feature, now with even more detailed insights into player behaviour.

What’s new with player overlap and what can you gain from it?

Using NBA 2K23 as our example, let’s explore a part of this further, just like we did in our last post about this feature.
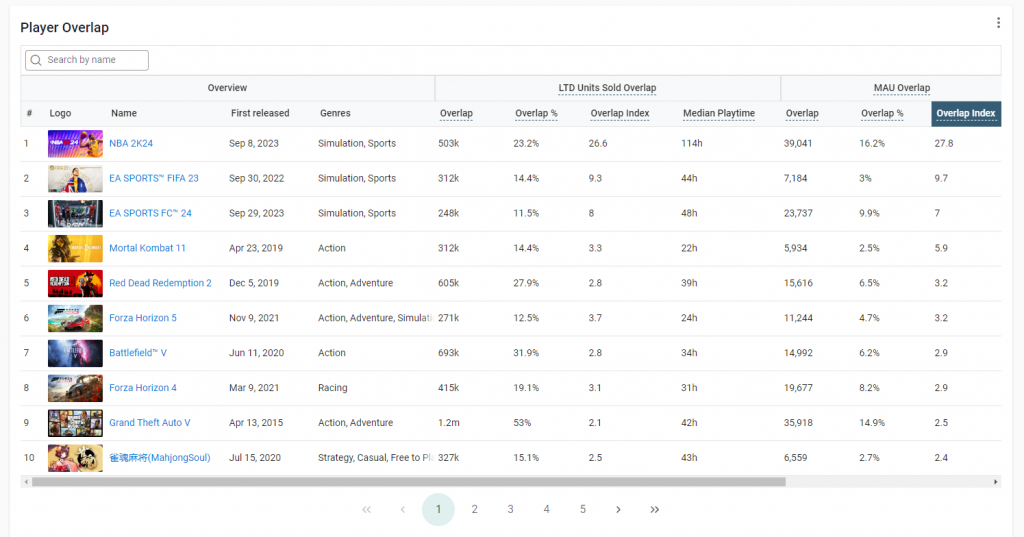
  • Median Playtime: reveals how many hours a typical player dedicates to NBA 2K23, based on what other games they play. You’ll find this data for all games in the “LTD Units Sold Overlap” section of the table. So you can now not only see what else players play, but also how dedicated they are to the main game in focus. For example, people who bought NBA 2K24 spent over a hundred hours in 2K23 while people who play games like Forza or Battlefield tend to be more casual NBA 2K players.

We’ve also introduced wishlist-related metrics for more depth, available only for unreleased games. Learn more about them below:

  • Wishlist Overlap: Looks at players who wishlisted the main game in focus and what else they’re playing on Steam.
  • Wishlist Overlap %: Indicates the percentage of main game wishlisters who play other games.
  • Wishlist Overlap Index: Measures how much more likely main game wishlisters are to play another game compared to the average player. A value of 0.5 means half as likely, while 2.0 means twice as likely.

These new metrics offer our Business subscribers deeper insights into player behavior, helping refine marketing strategies and uncover market opportunities.

Custom Games Lists

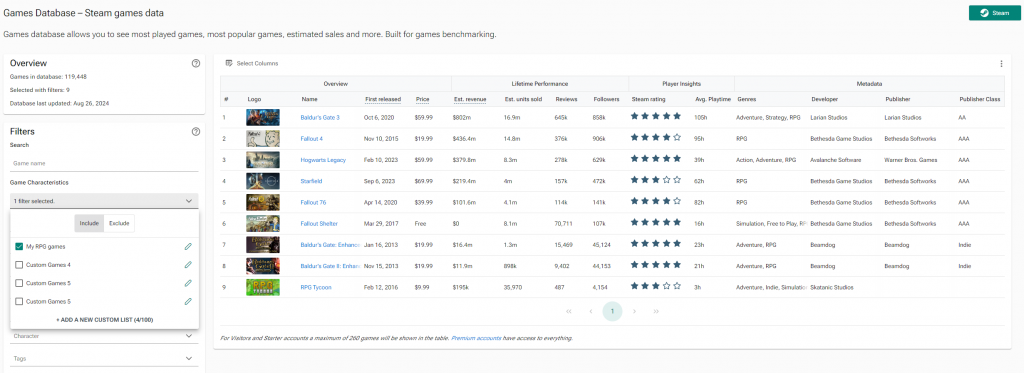
Do you have a specific list of games you’d like to track or summarise data for? Well, now you can (finally)!
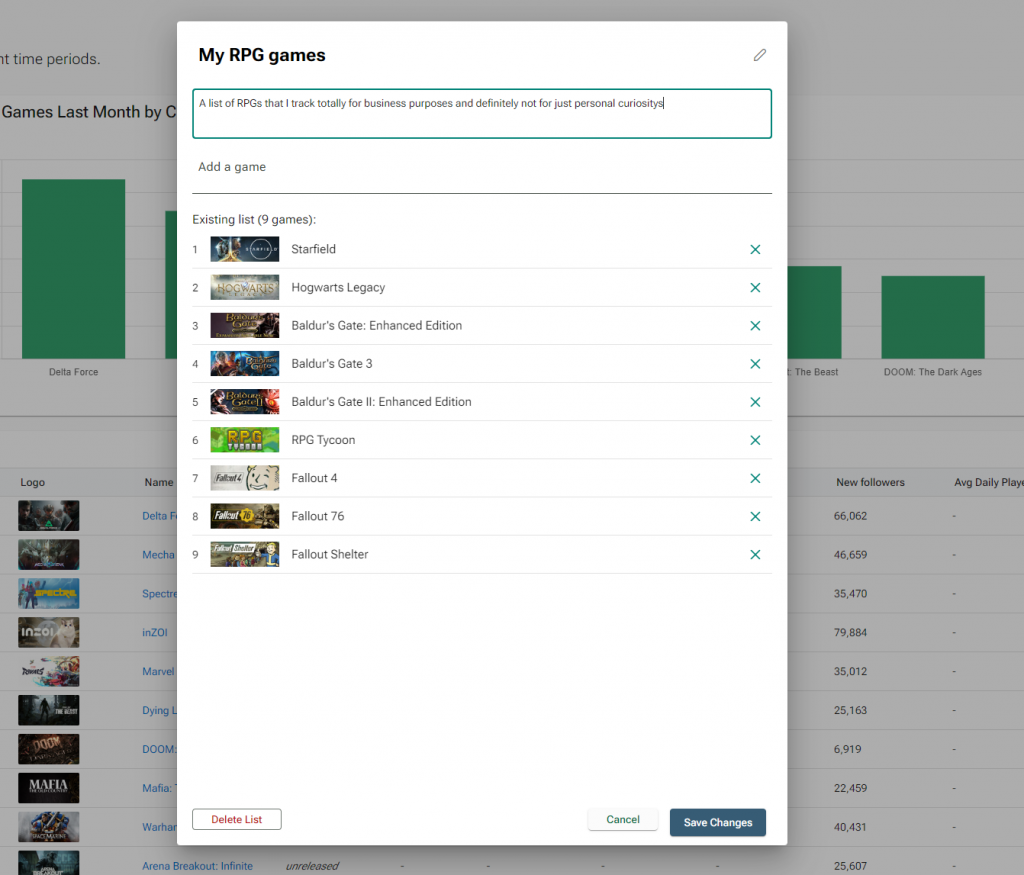
Indie and Business subscribers are now able to set up custom lists with whatever games they’d like. These lists can then be used on any page with filters (Games Database, Top Charts, Steam Analytics etc).
For more details, you can always reach out to us at support@vginsights.com!

Categories
How to Use VGI Updates

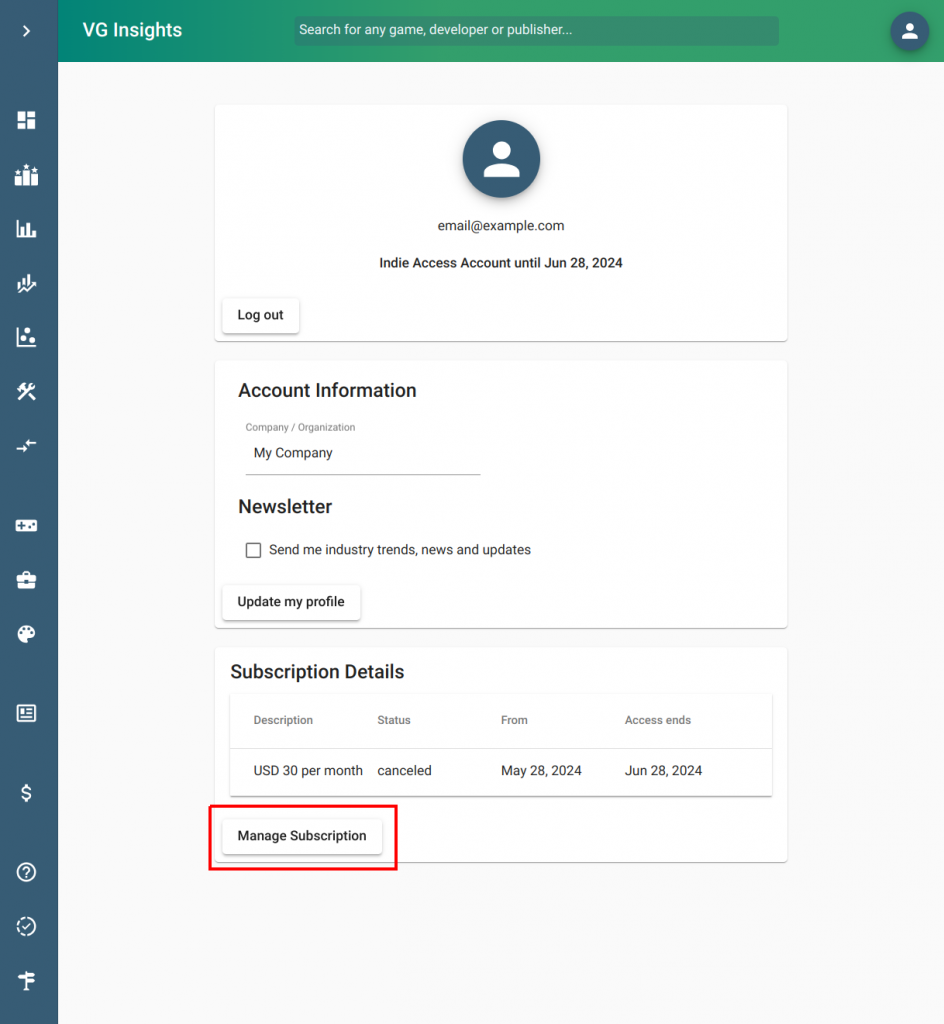
Better Subscription Management: Introducing the Customer Portal

Exciting news: managing your VGI subscriptions is now easier than ever. Our platform integrates with the Stripe customer portal, offering you more control. Access all your subscription needs in one place.

What’s New?

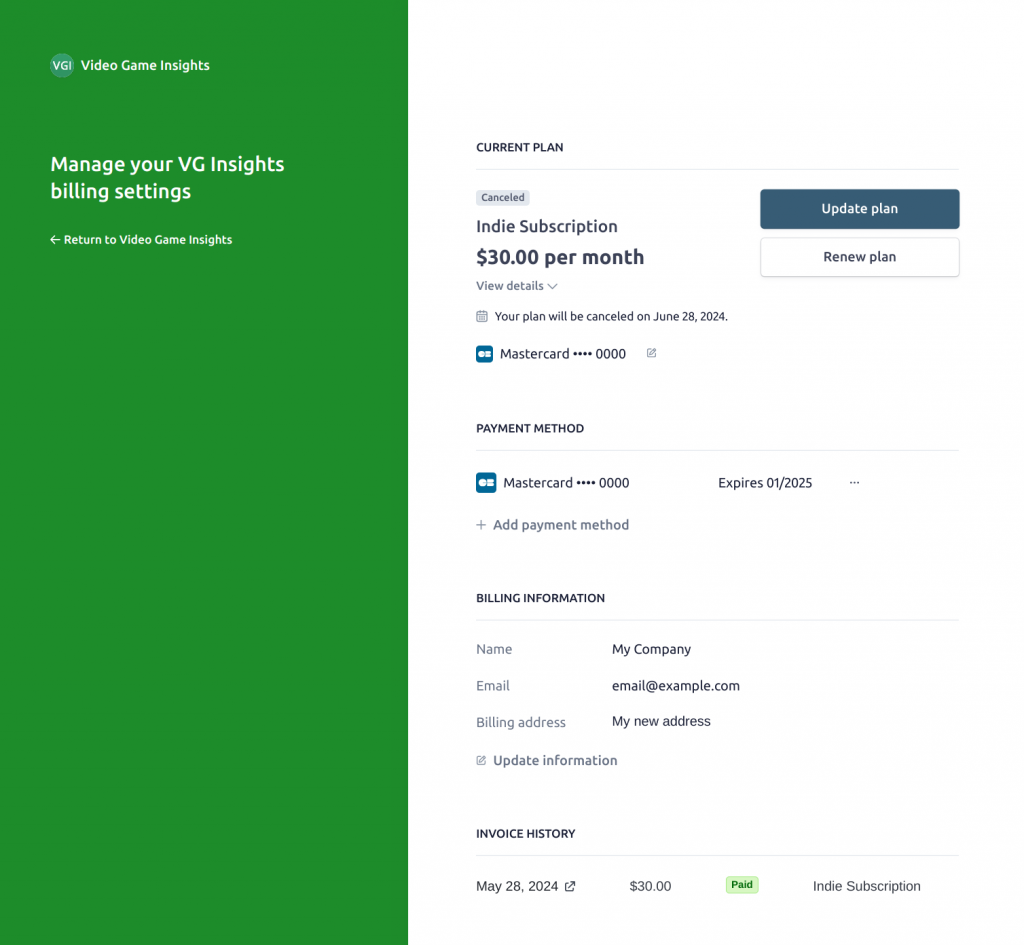
We’ve enhanced how you manage your VGI subscriptions by connecting directly with Stripe. Now, you can access a wide range of options, including:

  • Subscription canceling: easily end your subscriptions directly through the portal
  • Changing your plan: switch between the available VGI plans
  • Viewing invoices: access and download your invoices anytime
  • Updating Payment Methods: revise your payment information as needed
  • Managing billing information: quickly make changes to your billing details

This update offers more control and flexibility around your subscription, improving your VGI experience.

Categories
Updates

Table Customisation: Make It Yours

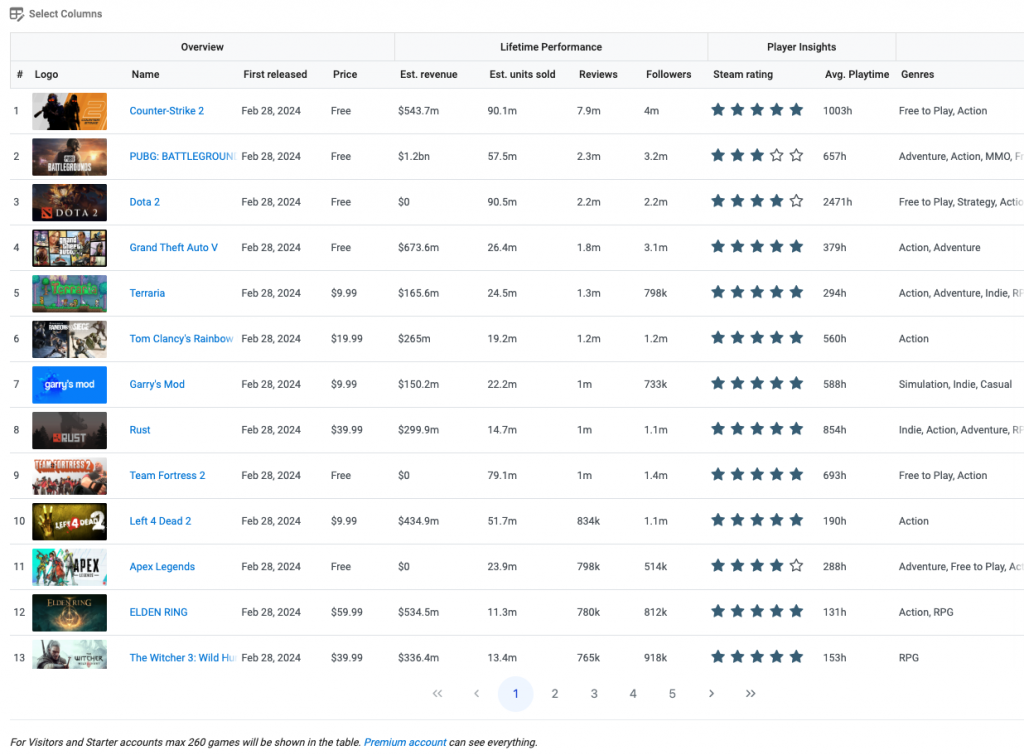
We’re thrilled to announce an update to the VGI platform that’s set to redefine your data interaction experience. Our tables have undergone a significant transformation, now featuring a more modern design. With customisable tables and streamlined design, we empower users to explore information in a more personal and engaging way.

Customise Your View

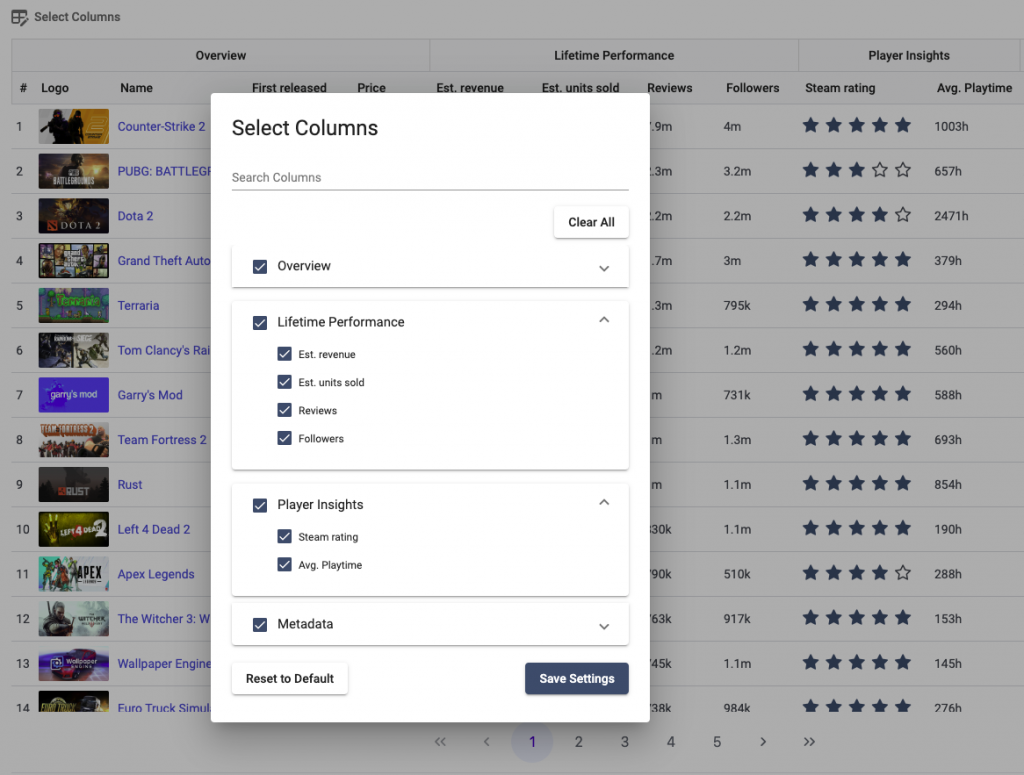
One key update we’re excited about is the ability to choose what data you see. At the heart of this update is a new icon located at the top of our table. A simple click on this icon unveils a dialog box, granting you the ability to select the columns you wish to view. Your preferences are saved and automatically applied on every visit to the page.

Tailor Your Data, Focus on What Matters

We understand everyone has different needs when looking at data. Whether you’re interested in the latest game releases, pricing, rating or reviews, our platform now enables you to streamline your data for a faster, more efficient, and personalised experience.

Try It Out

Check out the updated tables on the VGI platform and see how easy it is to adapt your data view. Give it a go and let us know what you think!

Stay tuned for more updates and features designed to improve your VGI experience.

Categories
Updates

Introducing Competitive Maps

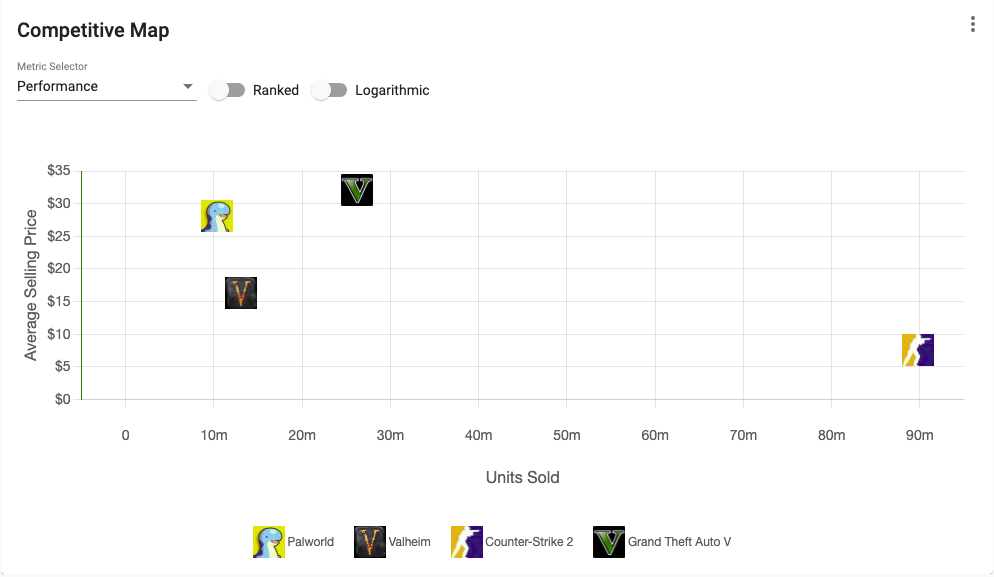
Exciting news for our users! We’ve launched Competitive Maps, a new feature on our Competitive Insights page. It offers a thorough analysis of games, comparing their market performance in sales, revenue, player engagement, and more.

Key Features:

  • Compare multiple games to see how they’re doing in the market.
  • Rank games by metrics like sales or playtime.
  • Use logarithmic view for better data comparison.

Benefits for All Users:

  • Indie developers can download charts as images for presentations and discussions.
  • Business accounts can export charts as Excel sheets for deeper data analysis.

Competitive Maps is your new ally in navigating the competitive landscape of the gaming industry. Start leveraging this feature to sharpen your market strategy and decisions.

Categories
Updates

Game Page Updates: New Insights

In this pre-Christmas update, we’ve revamped our game page. Let’s explore these new features, which provide deeper insights into the gaming universe.

1. Visual Media Display

Firstly, our game page now features a new visual media section. Located at the top, it includes game screenshots, images, and videos. Users can get a quick visual insight into the game’s world. The section highlights the game’s environment and graphics.

Carousel-like visual component containing game media.

2. In-Depth Commercial Performance Chart

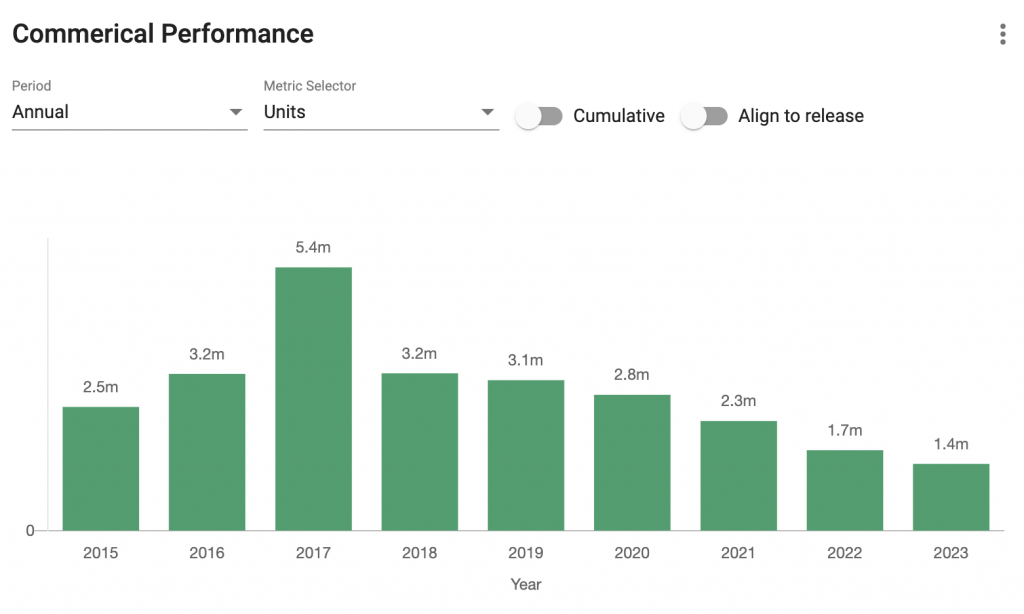
The biggest change is our Commercial Performance chart. This chart provides detailed insights into a game’s market performance, including estimated sales and total revenue. The tool is invaluable for industry professionals.

Indie developers can download commercial data charts as an image. Business accounts have the added option to export these charts as Excel sheets.

Commercial Performance Chart
Commercial Performance chart with filters for period, metrics, and export options.

3. Updated Player Insights Chart

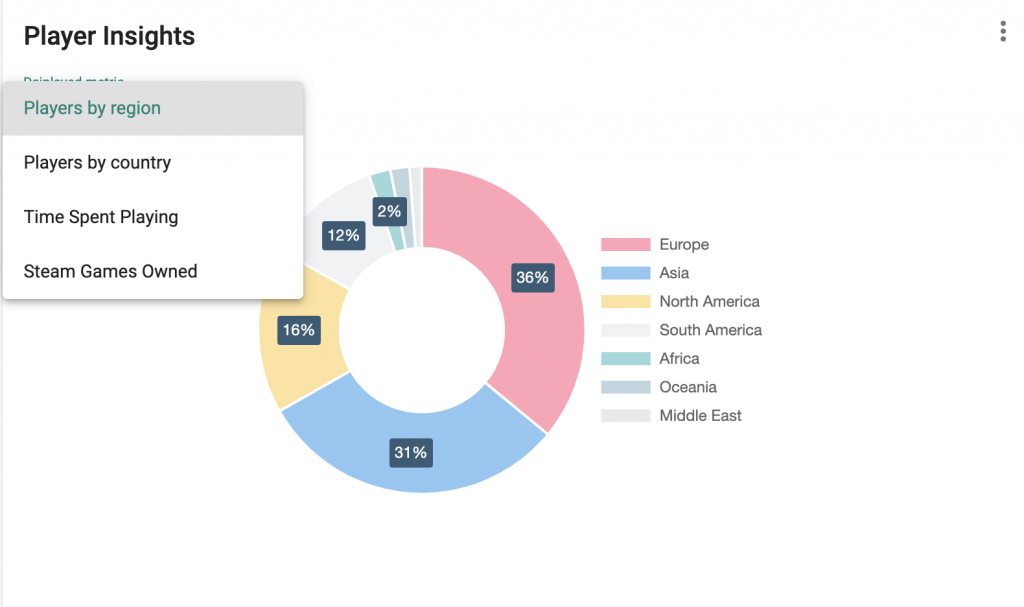
Finally, we’ve enhanced our Player Insights chart to improve user-friendliness. All options are now neatly organised in a dropdown menu. Existing metrics remain available and unchanged. The updated design focuses on ease of navigation and quick data access.

This chart is especially valuable for our premium users. For indie developers, it offers key insights into player demographics by region. Thus, they gain a better understanding of their audience.

The business accounts benefit from more extensive data. They receive detailed game metrics from country split of sales to player engagement levels. This comprehensive information is vital for making informed decisions in the competitive gaming market.

Player Insights Chart
Revamped Player Insights chart.

This latest update significantly enhances the Game Page, building upon the previous improvements.

Examine the example Valheim Game Page to see these features in action. Stay informed and ahead in the gaming world with our enhanced game page. Happy exploring!