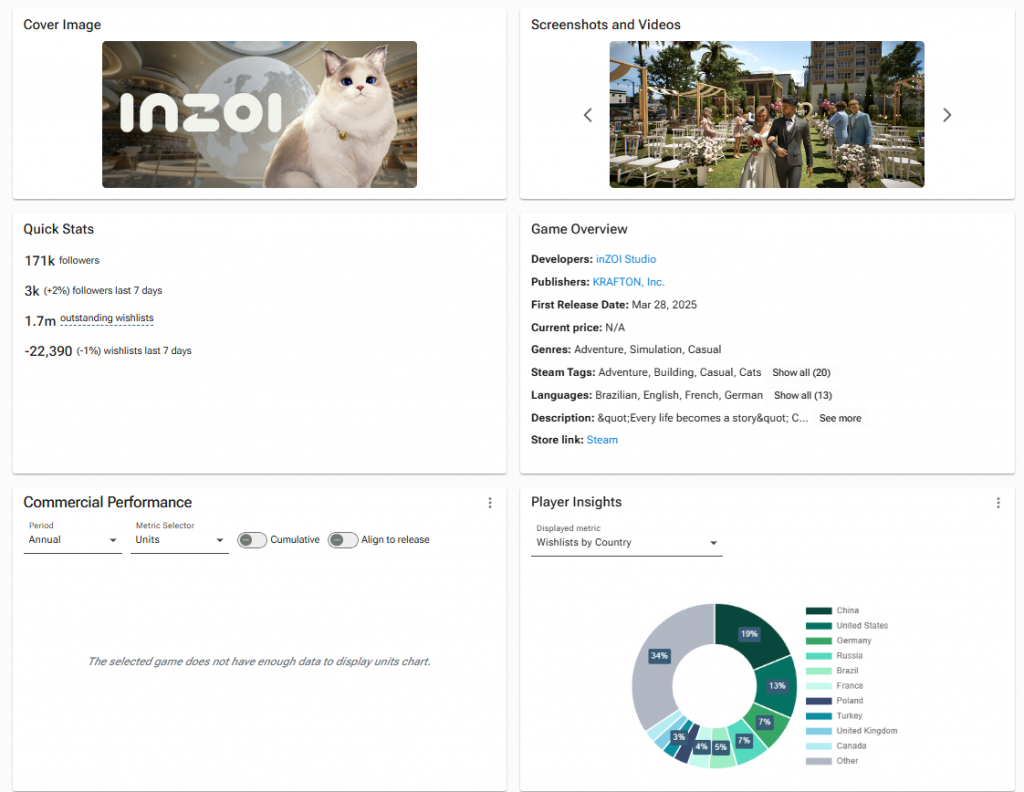
We are now showing wishlist breakdown by country estimate for unreleased (and also released) games! You can now see where the interest towards a game is coming from.
Posts with “Updates” category will be shown at changelog/updates page

We are now showing wishlist breakdown by country estimate for unreleased (and also released) games! You can now see where the interest towards a game is coming from.
We have added a couple of much requested features to the paltform recently:
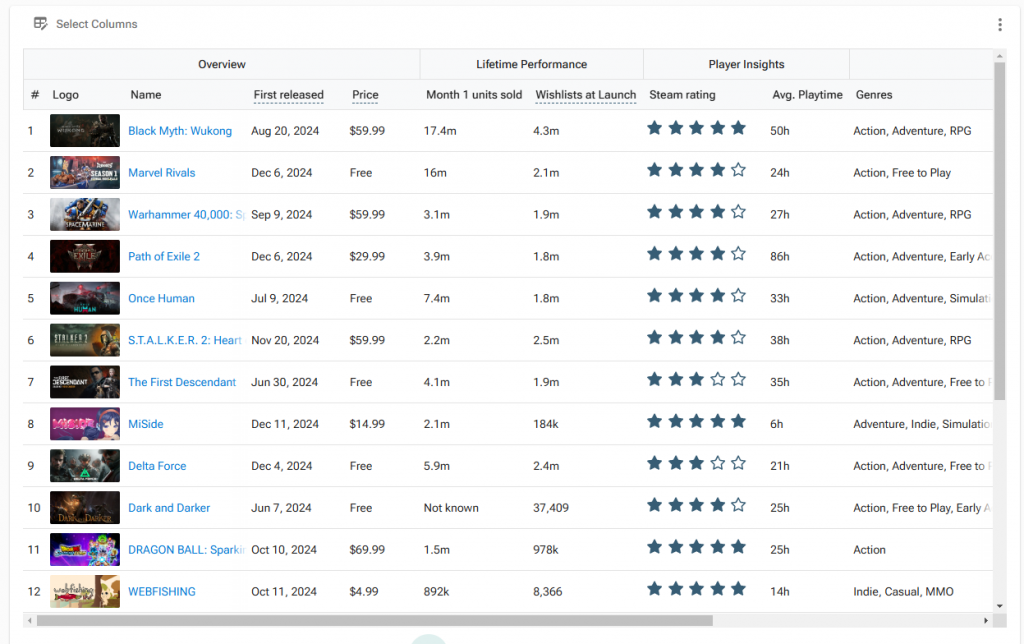
We’ve added 2 new columns to the Games Database – Month 1 and Year 1 unit sales. This allows you to have quick like-for-like comparison for launch performances.
Not only that, you can use these together with our “wishlists at launch” metric to get a better understanding of the wishlist to launch conversion ratios for the games you care about.
https://app.sensortower.com/vgi/games-database
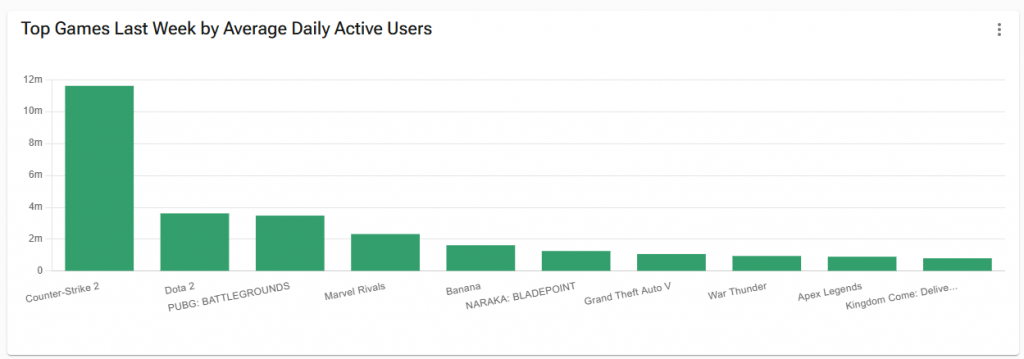
Top charts already had an option to see top CCU games. Our new DAU and MAU options add more colour to player engagement.
https://app.sensortower.com/vgi/top-charts
You will be now able to see when the actual Steam Store page was created for majority of games, including how long it took them to get from Store page creation to launch.
This is a super useful metric for understanding how to optimize the Steam page and how early other games release their Steam pages pre launch.
https://app.sensortower.com/vgi/game/kingdom-come-deliverance-ii

We’ll be bringing you more new features shortly! Stay tuned.
We have just added game engines as a datapoint to all games. As a business subscriber, you’ll be able to see the game engines for most games with >10k sales.
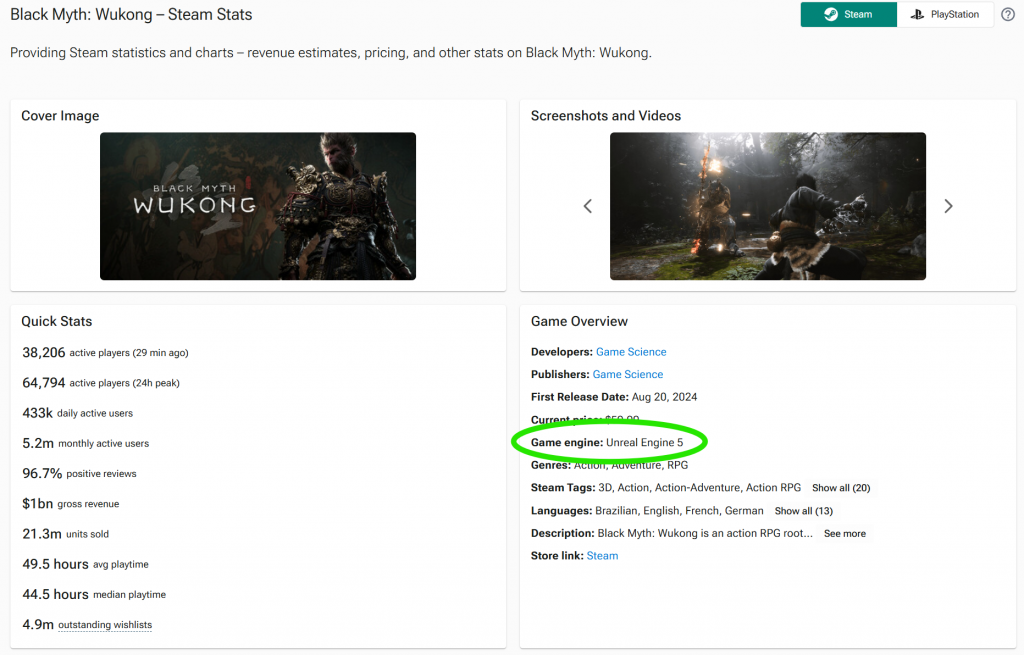
Business subscribers will also be able to see game engines as a separate column in the Games Database.
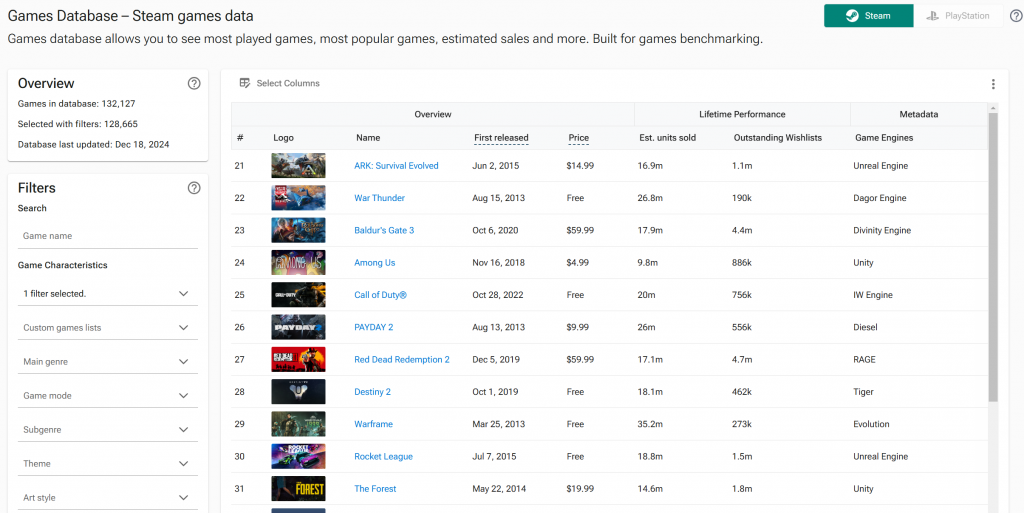
You’ll also be able to filter games based on the engines!
Our wishlist estimates have been the best in class since we launched them back in March. Well, they’ve just got a bit better. We have had to tweak our methodology slightly and this has resulted in even smaller variance VS actual numbers in our internal checks.
Key changes:
This impacts all wishlist numbers we show. We encourage you to update any analysis that relied on the old numbers.
Note that we try and keep any large scale estimation changes to a minimum, but in order to provide you with the best estimates possible, we do occasionally need to make these changes.
We will make sure to give a heads up in the future rather than report any changes retroactively.
We’ve just released our estimates for daily active users (DAU) and weekly active users (WAU) for Steam games.
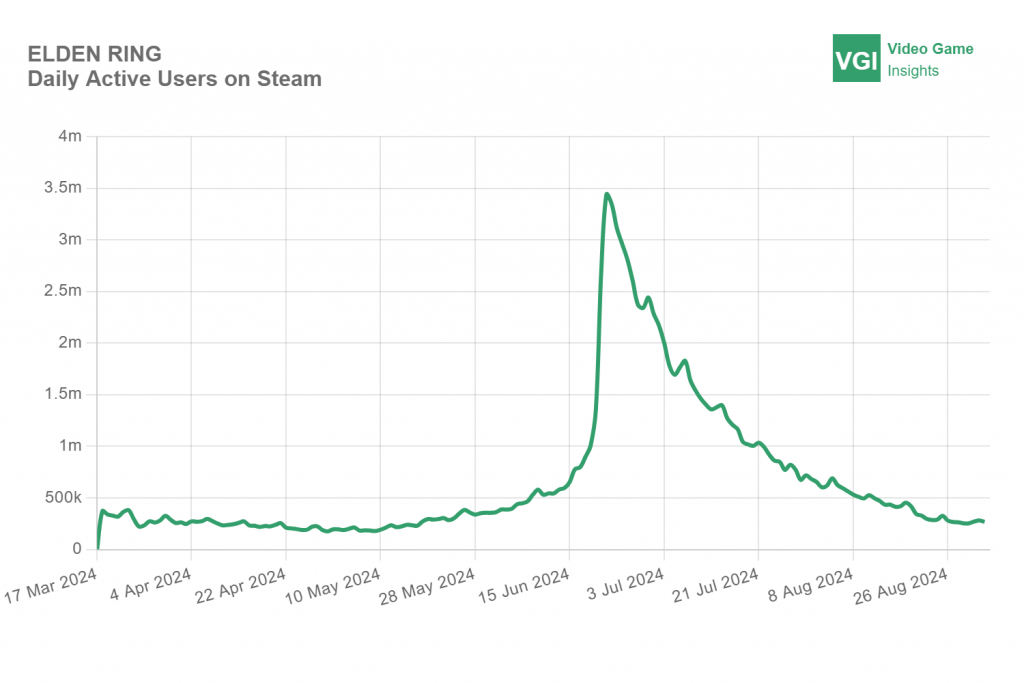
You’ll be able to see these metrics for any game with at least 100k units sold by going on their individual games page and using the “historical data” section.
Note that these metrics do tend to give a highly correlated view to the much used concurrent users (CCU) metric on Steam. However, DAU and WAU are much more used in corporate environments and serve as a more practical input for most modelling purposes.
Additionally, the DAU metric sets us up for the upcoming PlayStation data where you will be able to start comparing PC & PS DAU metrics and see what the platform mix looks like for multi-platform games.
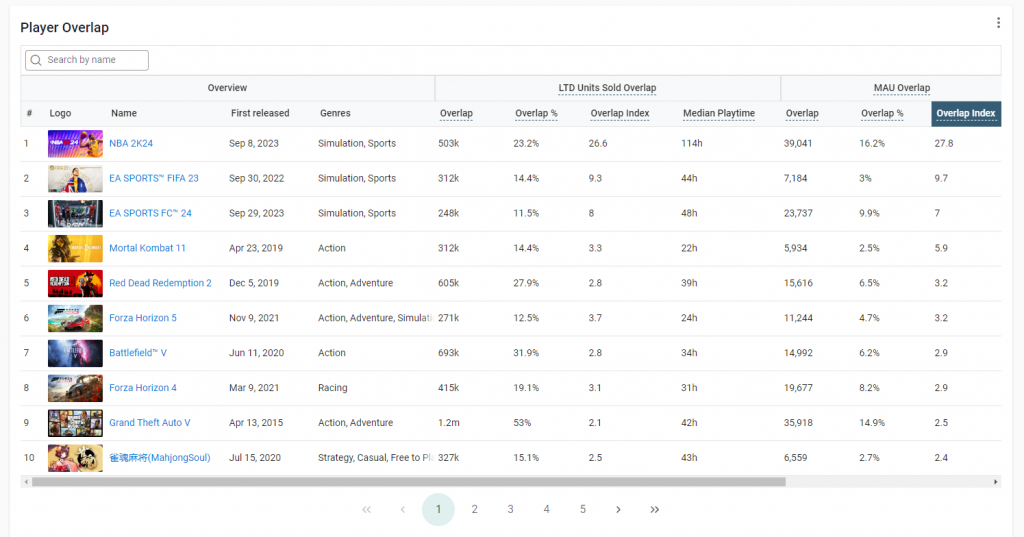
We’re excited to roll out a cool update to our Player Overlap feature, now with even more detailed insights into player behaviour.
Using NBA 2K23 as our example, let’s explore a part of this further, just like we did in our last post about this feature.
We’ve also introduced wishlist-related metrics for more depth, available only for unreleased games. Learn more about them below:
These new metrics offer our Business subscribers deeper insights into player behavior, helping refine marketing strategies and uncover market opportunities.
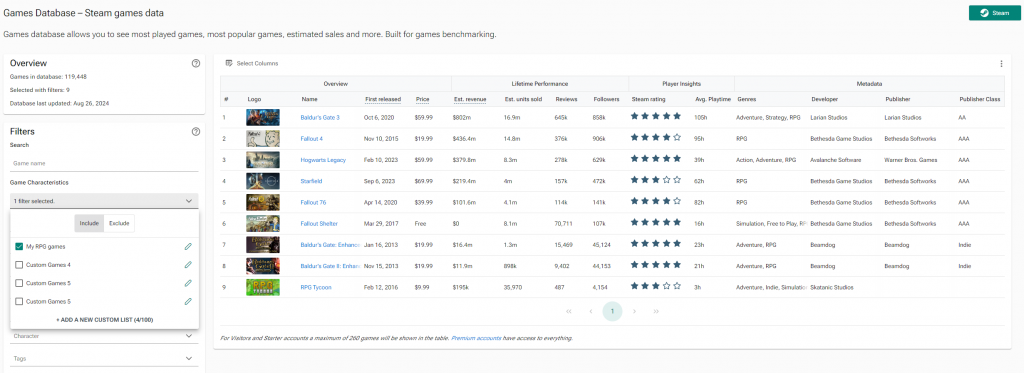
Do you have a specific list of games you’d like to track or summarise data for? Well, now you can (finally)!
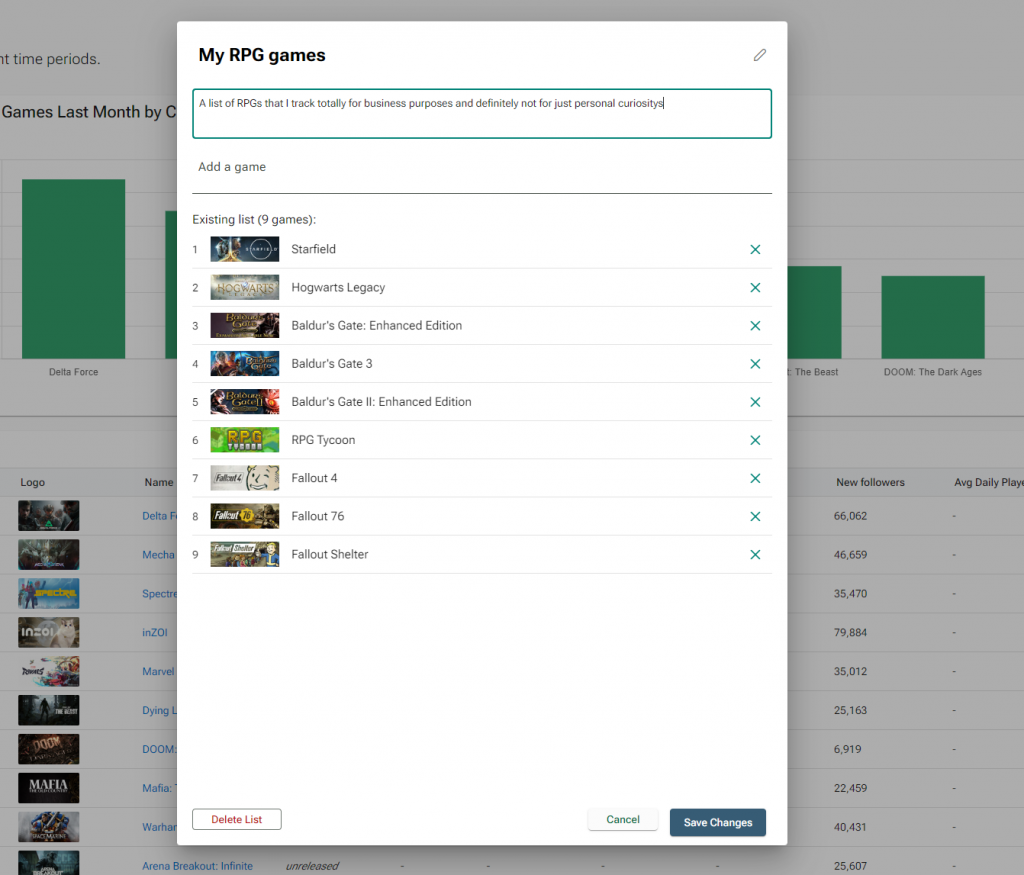
Indie and Business subscribers are now able to set up custom lists with whatever games they’d like. These lists can then be used on any page with filters (Games Database, Top Charts, Steam Analytics etc).
For more details, you can always reach out to us at support@sensortower.com!
We have revamped our filter system, making it easier to use and improving its functionality.
Filters are available on many pages, from Steam Analytics to Games Database and can help you narrow down a list of games or companies to look at. We’ve long had an extensive list of filters to choose from, but we’ve now made it even more powerful to use.
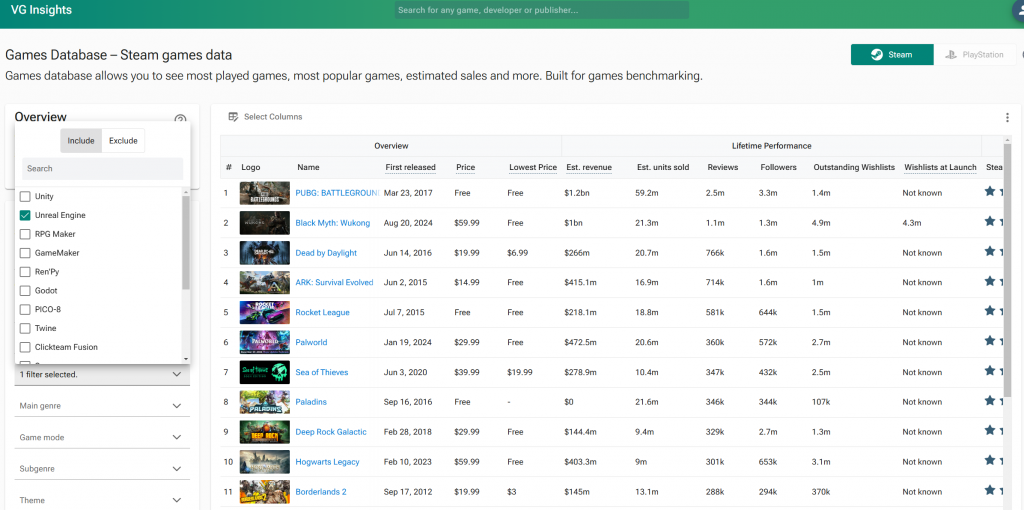
You can now include as well as exclude characteristics in filters. For example, you might want to see all 4x games, but exclude any turn-based games, leaving only real time 4x games in the list.
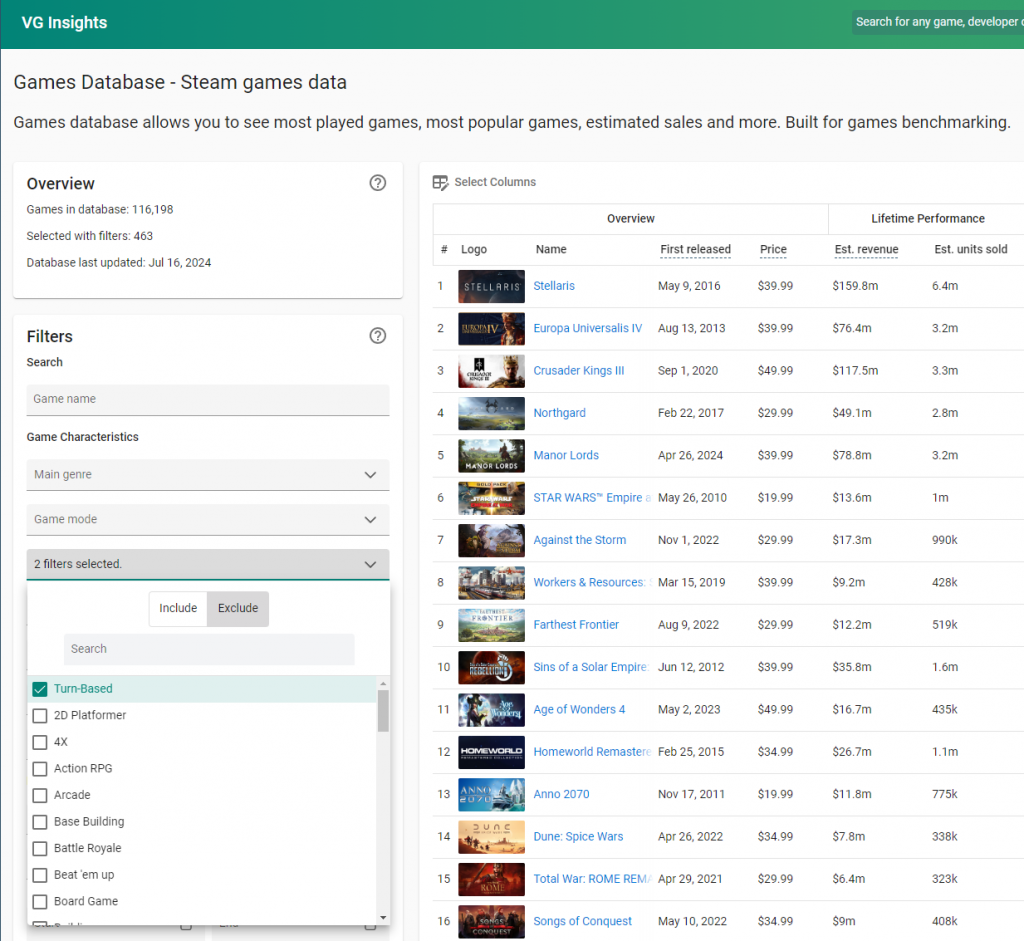
Some of our filters had tens if not hundreds of options to choose from. We have now added a search bar to make it easier to look for the particular item you’re interested in. For example, you can now find all the RPG tags with ease.

Exciting news: managing your VGI subscriptions is now easier than ever. Our platform integrates with the Stripe customer portal, offering you more control. Access all your subscription needs in one place.
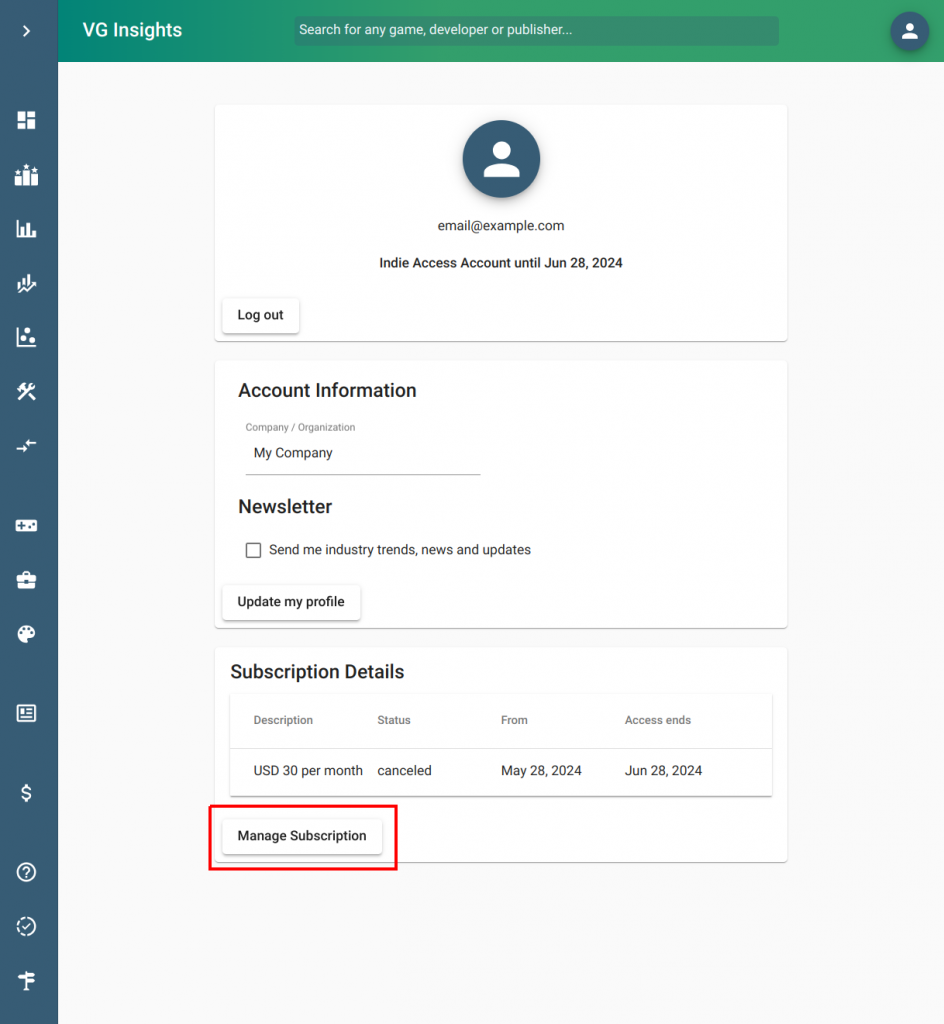
We’ve enhanced how you manage your VGI subscriptions by connecting directly with Stripe. Now, you can access a wide range of options, including:
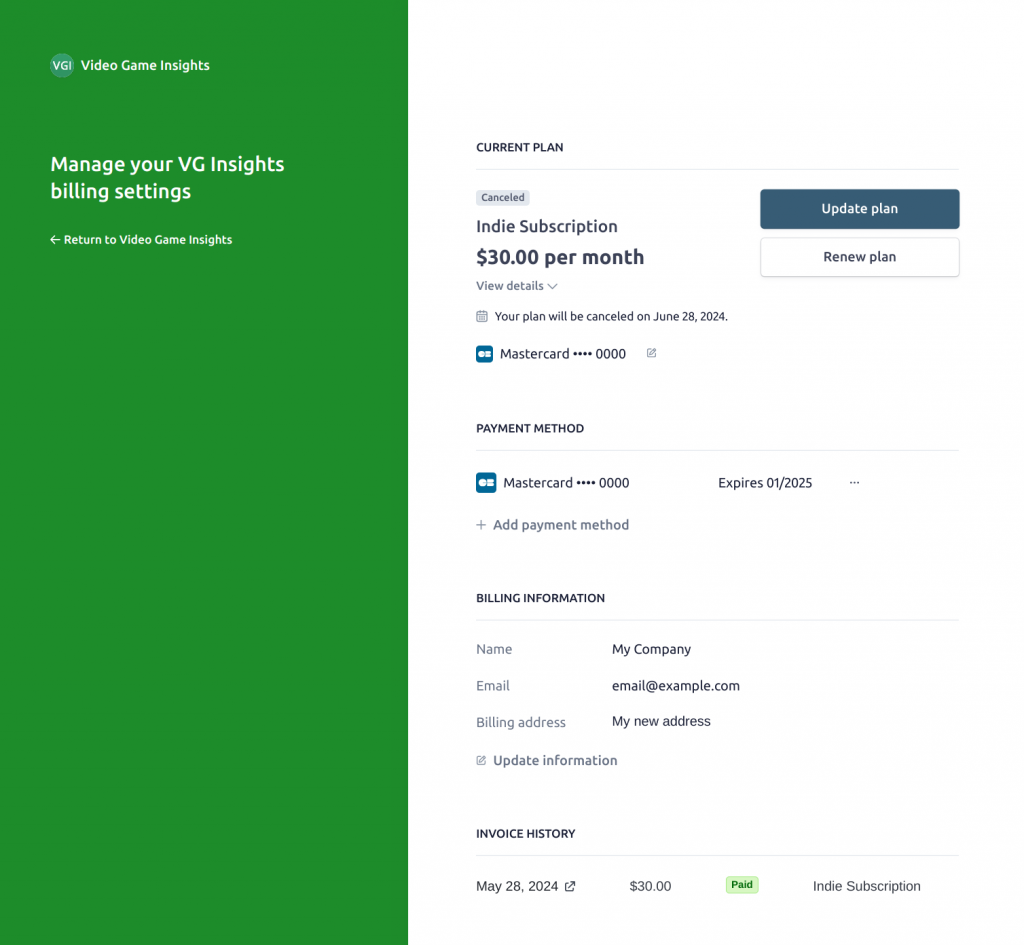
This update offers more control and flexibility around your subscription, improving your VGI experience.
We have officially released a long requested feature – Player Overlap. You will now be able to see what other games players play for majority of games on Steam.
Using the example of NBA 2K23, we can now see that NBA 2K players are more likely to also play other NBA 2K games (not surprising). But they’re also 20x more likely to play PGA Tour 2K23 (because there was a bundle c. 1 year ago). Interestingly, they are also much more likely to play Madden than your typical Steam player. That is mostly due to US focused playerbases for both games.
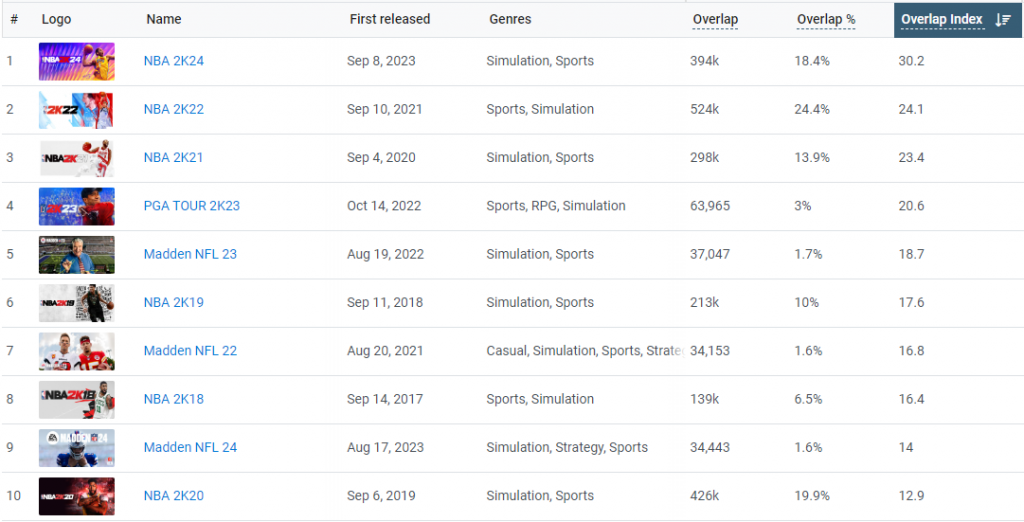
Firstly, we’re showing overlap metrics for both lifetime sales (LTD) as well as last month’s active users (MAU).
LTD units sold overlap shows any Steam player who owns both games.
MAU overlap shows any Steam player who has played both games in the last 30 days.
Overlap itself shows actual # of people who own both games. Eg 394k people on Steam have both NBA 2K23 and 2K24.
Overlap % shows what % of all NBA 2K23 players own other games. Eg 18.4% of NBA 2K23 players have also bought NBA 2K24.
Overlap Index, perhaps most important of the 3, shows how many times more or less likely an owner of a game is to play other games. For example, an average NBA 2K23 player is 30x more likely to own NBA 2K24 VS your typical Steam player.
This is a new feature and still in its Beta phase. We’ve tested it extensively, however, there might still be edge cases to iron out. We’re confident that it is directionally right for majority of games, but we will continue to monitor it and tweak where needed. Note that all of these metrics are estimates based on sample sizes and therefore should never be treated as 100% accurate.
Methodology
Overlap % – We look at a large sample size of Steam players to see what games they play. In the NBA 2K23 example. we look at what % of players of NBA 2K23 in our sample play, for example, NBA 2K24. This is used to calculate the overlap %s.
Overlap – We then apply the overlap % to particular game’s (in this case, NBA 2K23’s) lifetime sales.
NOTE that because of that, the absolute overlap # for NBA 2K23 with NBA 2K24 does not match NBA 2K24’s overlap # with NBA 2K23. However, they are in the same ballpark and directionally similar. This is a fluke of this methodology and we will be looking to improve this going forward.
Overlap index – We take the NBA 2K23 overlap % with NBA 2K24 and divide it with Global NBA 2K24 owners %. In this instance, we know that 18.4% of NBA 2K23 owners own 2K24, but only 0.61% of all Steam players own NBA 2K24.
The Overlap Index is therefore 18.4%/0.61%=30.2
In this example, we can see that these overlaps also work for very new games. The MAU overlap also exposes how popular games tend to overlap with other recently more popular games. For example, Fallout 4 is the 3rd most popular game to be played by Helldivers 2 players in May 2024 as a result of the recent Fallout TV show success. Other recent release, Content Warning also makes it to the top 10.

This is a feature currently only for our Business Subscribers.
It’s designed to help larger studios and publishers to better understand their own playerbase. It can be used to optimize marketing targeting, to understand cannibalization and relative market shares between competitive games and to see what type of game elements and features your players might enjoy more.
Reach out to us at support@sensortower.com to learn more!
We have significantly increased the accuracy of our player insights – average and median playtime as well as the country split of units sold.
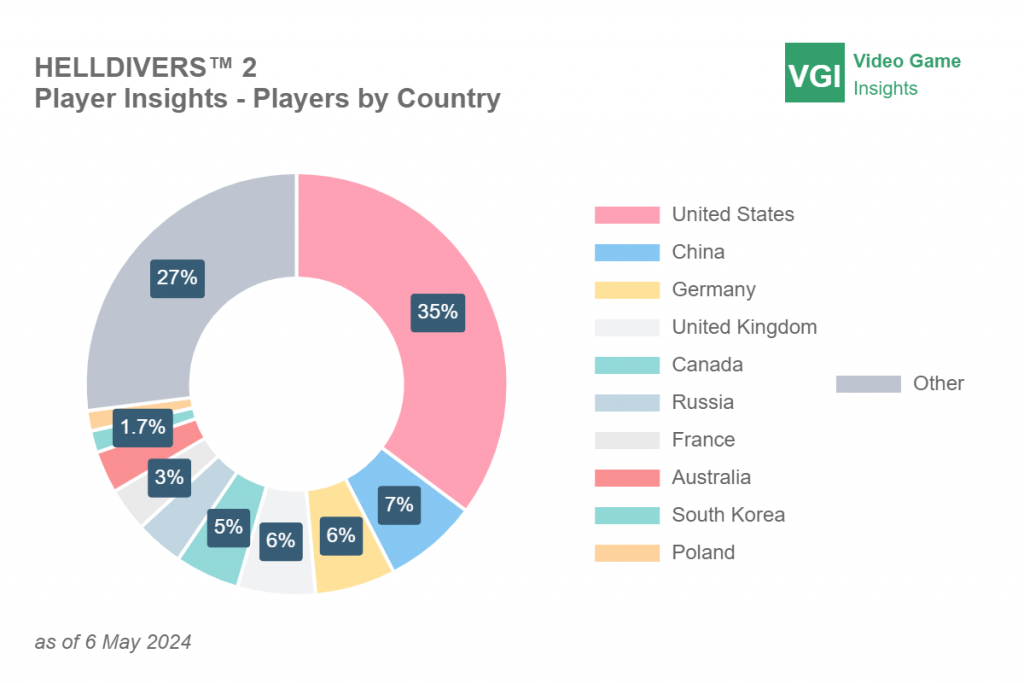
Going forward, we will be able to also start showing how playtime and country splits change over time.
This is also a precursor for the long anticipated Player Overlap feature, launching in the coming weeks.